|
Download Data (XLS File) |
|
||||||||
|
||||||||
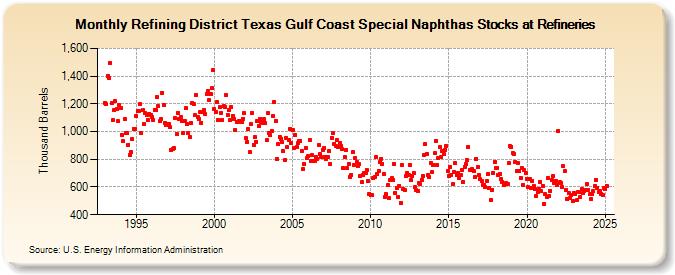
| Refining District Texas Gulf Coast Special Naphthas Stocks at Refineries (Thousand Barrels) | ||||||||
| Year | Jan | Feb | Mar | Apr | May | Jun | Jul | Aug | Sep | Oct | Nov | Dec |
|---|---|---|---|---|---|---|---|---|---|---|---|---|
| 1993 | 1,208 | 1,198 | 1,403 | 1,386 | 1,496 | 1,203 | 1,080 | 1,153 | 1,217 | 1,160 | 1,073 | 1,191 |
| 1994 | 1,170 | 978 | 930 | 1,088 | 992 | 989 | 905 | 834 | 851 | 943 | 1,020 | 1,016 |
| 1995 | 1,109 | 1,146 | 1,145 | 1,198 | 987 | 1,152 | 1,054 | 1,134 | 1,119 | 1,086 | 1,130 | 1,118 |
| 1996 | 1,108 | 1,085 | 1,159 | 1,154 | 1,246 | 1,182 | 1,074 | 1,089 | 1,281 | 1,188 | 1,061 | 1,045 |
| 1997 | 1,056 | 1,056 | 1,030 | 864 | 877 | 879 | 1,097 | 983 | 1,136 | 1,087 | 1,106 | 1,075 |
| 1998 | 990 | 1,075 | 1,168 | 1,054 | 988 | 961 | 1,064 | 1,208 | 1,197 | 1,116 | 1,264 | 1,107 |
| 1999 | 1,093 | 1,142 | 1,064 | 1,141 | 1,156 | 1,125 | 1,272 | 1,291 | 1,227 | 1,269 | 1,311 | 1,444 |
| 2000 | 1,161 | 1,142 | 1,211 | 1,085 | 1,176 | 1,137 | 1,082 | 1,183 | 1,180 | 1,264 | 1,121 | 1,155 |
| 2001 | 1,086 | 1,175 | 1,115 | 1,091 | 1,014 | 1,070 | 1,070 | 1,076 | 1,075 | 1,072 | 1,093 | 1,134 |
| 2002 | 951 | 926 | 1,020 | 849 | 1,055 | 1,136 | 906 | 962 | 925 | 1,073 | 1,041 | 1,094 |
| 2003 | 1,070 | 1,060 | 1,087 | 1,060 | 939 | 1,131 | 990 | 974 | 1,007 | 1,111 | 1,213 | 1,077 |
| 2004 | 804 | 908 | 963 | 948 | 922 | 857 | 792 | 954 | 886 | 938 | 1,019 | 918 |
| 2005 | 1,013 | 882 | 977 | 892 | 915 | 933 | 934 | 861 | 729 | 767 | 884 | 810 |
| 2006 | 824 | 942 | 785 | 830 | 785 | 791 | 819 | 804 | 903 | 836 | 818 | 869 |
| 2007 | 882 | 818 | 804 | 818 | 858 | 769 | 956 | 989 | 912 | 893 | 940 | 892 |
| 2008 | 920 | 899 | 873 | 734 | 815 | 870 | 734 | 767 | 674 | 690 | 849 | 759 |
| 2009 | 808 | 779 | 751 | 764 | 677 | 634 | 690 | 703 | 699 | 723 | 644 | 551 |
| 2010 | 540 | 542 | 664 | 675 | 814 | 694 | 714 | 778 | 805 | 769 | 695 | 529 |
| 2011 | 546 | 612 | 517 | 651 | 664 | 652 | 768 | 557 | 595 | 528 | 608 | 486 |
| 2012 | 759 | 589 | 581 | 679 | 704 | 688 | 759 | 650 | 682 | 698 | 599 | 576 |
| 2013 | 573 | 628 | 618 | 653 | 680 | 829 | 907 | 841 | 690 | 669 | 776 | 705 |
| 2014 | 759 | 842 | 935 | 761 | 811 | 890 | 813 | 861 | 841 | 870 | 896 | 714 |
| 2015 | 680 | 743 | 689 | 619 | 707 | 773 | 688 | 702 | 666 | 689 | 725 | 639 |
| 2016 | 745 | 766 | 792 | 891 | 724 | 726 | 728 | 713 | 671 | 805 | 744 | 687 |
| 2017 | 655 | 640 | 613 | 617 | 601 | 644 | 695 | 595 | 507 | 581 | 703 | 782 |
| 2018 | 738 | 738 | 690 | 695 | 659 | 637 | 616 | 624 | 627 | 624 | 776 | 893 |
| 2019 | 892 | 844 | 839 | 781 | 716 | 774 | 713 | 665 | 738 | 616 | 721 | 701 |
| 2020 | 661 | 597 | 656 | 594 | 645 | 607 | 583 | 533 | 561 | 586 | 638 | 570 |
| 2021 | 610 | 479 | 549 | 529 | 665 | 536 | 572 | 647 | 679 | 629 | 646 | 614 |
| 2022 | 1,003 | 633 | 627 | 600 | 748 | 715 | 580 | 510 | 556 | 522 | 541 | 499 |
| 2023 | 560 | 547 | 504 | 563 | 561 | 527 | 585 | 558 | 568 | 581 | 620 | 581 |
| 2024 | 547 | |||||||||||
| - = No Data Reported; -- = Not Applicable; NA = Not Available; W = Withheld to avoid disclosure of individual company data. |
| Release Date: 3/29/2024 |
| Next Release Date: 4/30/2024 |
Referring Pages: