|
Download Data (XLS File) |
|
||||||||
|
||||||||
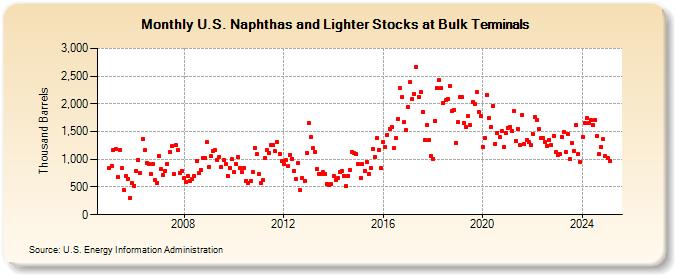
| U.S. Naphthas and Lighter Stocks at Bulk Terminals (Thousand Barrels) | ||||||||
| Year | Jan | Feb | Mar | Apr | May | Jun | Jul | Aug | Sep | Oct | Nov | Dec |
|---|---|---|---|---|---|---|---|---|---|---|---|---|
| 2005 | 838 | 875 | 1,165 | 1,178 | 681 | 1,172 | 842 | 444 | 690 | 653 | 310 | 570 |
| 2006 | 524 | 784 | 987 | 751 | 1,374 | 1,160 | 933 | 911 | 735 | 921 | 619 | 580 |
| 2007 | 1,062 | 827 | 720 | 793 | 915 | 1,134 | 1,233 | 739 | 1,256 | 1,162 | 756 | 795 |
| 2008 | 666 | 593 | 702 | 613 | 652 | 694 | 961 | 746 | 811 | 1,023 | 1,024 | 1,306 |
| 2009 | 868 | 1,053 | 1,147 | 1,160 | 982 | 1,039 | 868 | 978 | 921 | 701 | 849 | 996 |
| 2010 | 764 | 908 | 1,037 | 846 | 762 | 844 | 615 | 573 | 606 | 762 | 1,208 | 1,087 |
| 2011 | 726 | 576 | 618 | 1,025 | 1,173 | 1,120 | 1,255 | 1,249 | 1,143 | 1,314 | 1,097 | 967 |
| 2012 | 919 | 985 | 876 | 1,086 | 1,009 | 794 | 641 | 935 | 441 | 662 | 613 | 1,109 |
| 2013 | 1,662 | 1,401 | 1,198 | 1,131 | 818 | 741 | 735 | 764 | 742 | 554 | 535 | 549 |
| 2014 | 697 | 631 | 657 | 768 | 789 | 706 | 515 | 703 | 808 | 1,130 | 1,108 | 1,099 |
| 2015 | 918 | 662 | 906 | 789 | 955 | 735 | 851 | 1,190 | 1,048 | 1,382 | 1,169 | 834 |
| 2016 | 1,309 | 1,218 | 1,442 | 1,546 | 1,577 | 1,203 | 1,391 | 1,735 | 2,280 | 2,124 | 1,667 | 1,527 |
| 2017 | 1,937 | 2,386 | 2,093 | 2,178 | 2,663 | 2,119 | 2,212 | 1,856 | 1,342 | 1,614 | 1,343 | 1,061 |
| 2018 | 1,013 | 1,697 | 2,282 | 2,424 | 2,282 | 2,013 | 2,061 | 2,090 | 2,323 | 1,873 | 1,896 | 1,285 |
| 2019 | 1,665 | 2,121 | 2,120 | 1,657 | 1,581 | 1,772 | 1,616 | 2,031 | 1,989 | 2,206 | 1,853 | 1,777 |
| 2020 | 1,222 | 1,389 | 2,161 | 1,741 | 1,580 | 1,960 | 1,283 | 1,481 | 1,394 | 1,508 | 1,219 | 1,474 |
| 2021 | 1,571 | 1,591 | 1,509 | 1,869 | 1,328 | 1,542 | 1,250 | 1,805 | 1,272 | 1,355 | 1,309 | 1,253 |
| 2022 | 1,448 | 1,764 | 1,717 | 1,544 | 1,381 | 1,380 | 1,305 | 1,244 | 1,352 | 1,257 | 1,422 | 1,134 |
| 2023 | 1,093 | 1,110 | 1,398 | 1,470 | 1,130 | 1,460 | 999 | 1,296 | 1,190 | 1,617 | 1,096 | 949 |
| 2024 | 1,405 | |||||||||||
| - = No Data Reported; -- = Not Applicable; NA = Not Available; W = Withheld to avoid disclosure of individual company data. |
| Release Date: 3/29/2024 |
| Next Release Date: 4/30/2024 |