|
Download Data (XLS File) |
|
||||||||
|
||||||||
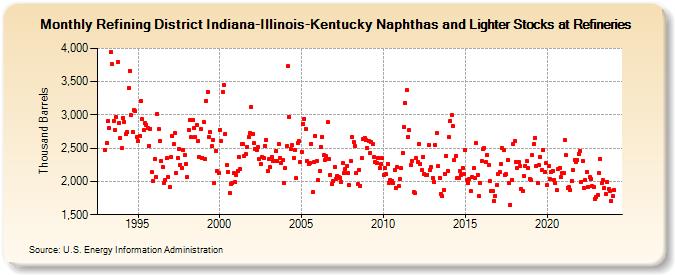
| Refining District Indiana-Illinois-Kentucky Naphthas and Lighter Stocks at Refineries (Thousand Barrels) | ||||||||
| Year | Jan | Feb | Mar | Apr | May | Jun | Jul | Aug | Sep | Oct | Nov | Dec |
|---|---|---|---|---|---|---|---|---|---|---|---|---|
| 1993 | 2,480 | 2,578 | 2,910 | 2,802 | 3,942 | 3,758 | 2,912 | 2,772 | 2,970 | 3,798 | 2,881 | 2,656 |
| 1994 | 2,497 | 2,949 | 2,894 | 2,706 | 2,743 | 3,403 | 3,667 | 2,994 | 2,740 | 3,068 | 3,053 | 2,661 |
| 1995 | 2,603 | 2,679 | 3,215 | 2,936 | 2,766 | 2,876 | 2,855 | 2,797 | 2,539 | 2,793 | 2,136 | 2,005 |
| 1996 | 2,333 | 2,062 | 3,021 | 2,783 | 2,609 | 2,309 | 2,217 | 1,980 | 2,016 | 2,345 | 2,071 | 1,917 |
| 1997 | 2,362 | 2,678 | 2,556 | 2,726 | 2,129 | 2,353 | 2,492 | 2,253 | 2,205 | 2,477 | 2,396 | 2,262 |
| 1998 | 2,064 | 2,778 | 2,924 | 2,661 | 2,931 | 2,796 | 2,661 | 2,852 | 2,609 | 2,369 | 2,787 | 2,358 |
| 1999 | 2,897 | 2,333 | 3,206 | 3,349 | 2,669 | 2,739 | 2,528 | 2,626 | 1,978 | 2,460 | 2,154 | 2,129 |
| 2000 | 2,778 | 2,612 | 3,347 | 3,453 | 2,719 | 2,246 | 2,148 | 1,828 | 1,964 | 1,971 | 2,122 | 1,988 |
| 2001 | 2,101 | 2,158 | 2,370 | 2,184 | 2,570 | 2,558 | 2,389 | 2,407 | 2,523 | 2,661 | 2,729 | 3,126 |
| 2002 | 2,716 | 2,576 | 2,492 | 2,467 | 2,513 | 2,333 | 2,255 | 2,366 | 2,346 | 2,537 | 2,625 | 2,155 |
| 2003 | 2,341 | 2,213 | 2,365 | 2,311 | 2,310 | 2,457 | 2,306 | 2,557 | 2,357 | 2,281 | 2,324 | 1,978 |
| 2004 | 2,196 | 2,526 | 3,731 | 2,974 | 2,487 | 2,548 | 2,354 | 2,469 | 2,046 | 2,583 | 2,601 | 2,291 |
| 2005 | 2,445 | 2,869 | 2,941 | 2,789 | 2,309 | 2,256 | 2,282 | 2,570 | 1,836 | 2,286 | 2,689 | 2,301 |
| 2006 | 2,021 | 2,152 | 2,523 | 2,675 | 2,393 | 2,324 | 2,377 | 2,887 | 2,338 | 2,103 | 1,957 | 2,002 |
| 2007 | 2,223 | 2,043 | 2,089 | 2,061 | 2,056 | 1,999 | 2,283 | 2,130 | 2,181 | 2,230 | 2,130 | 1,941 |
| 2008 | 2,311 | 2,668 | 2,588 | 2,528 | 2,124 | 1,956 | 2,175 | 1,937 | 2,352 | 2,637 | 2,657 | 2,628 |
| 2009 | 2,501 | 2,615 | 2,432 | 2,600 | 2,566 | 2,370 | 2,295 | 2,270 | 2,353 | 2,196 | 2,266 | 2,352 |
| 2010 | 2,099 | 2,202 | 2,105 | 2,264 | 1,980 | 2,023 | 2,012 | 1,978 | 2,176 | 1,903 | 2,215 | 1,925 |
| 2011 | 2,040 | 2,195 | 2,427 | 2,818 | 3,184 | 3,370 | 2,675 | 2,767 | 2,244 | 2,313 | 1,835 | 1,822 |
| 2012 | 2,345 | 2,296 | 2,565 | 2,264 | 2,165 | 2,375 | 2,115 | 2,102 | 2,101 | 2,550 | 2,174 | 2,216 |
| 2013 | 2,059 | 1,992 | 2,549 | 2,727 | 2,226 | 2,057 | 1,814 | 1,777 | 1,873 | 2,112 | 2,388 | 2,158 |
| 2014 | 2,664 | 2,911 | 3,000 | 2,829 | 2,327 | 2,385 | 2,045 | 2,058 | 2,160 | 2,097 | 2,204 | 2,117 |
| 2015 | 2,473 | 2,015 | 1,977 | 2,031 | 1,851 | 2,070 | 2,197 | 2,055 | 2,574 | 2,102 | 1,777 | 1,971 |
| 2016 | 2,308 | 2,485 | 2,503 | 2,295 | 2,397 | 2,243 | 2,000 | 1,855 | 1,850 | 1,709 | 1,781 | 1,954 |
| 2017 | 2,105 | 2,137 | 2,257 | 2,502 | 2,468 | 2,101 | 2,107 | 2,323 | 1,978 | 1,650 | 2,028 | 2,567 |
| 2018 | 2,604 | 2,297 | 2,208 | 2,288 | 2,232 | 1,893 | 1,852 | 2,087 | 2,236 | 2,303 | 2,203 | 2,031 |
| 2019 | 2,016 | 2,397 | 2,559 | 2,657 | 2,228 | 1,979 | 2,242 | 2,371 | 2,172 | 2,478 | 2,138 | 2,272 |
| 2020 | 1,946 | 2,238 | 2,031 | 2,137 | 2,164 | 2,027 | 1,974 | 1,864 | 2,180 | 2,209 | 2,065 | 2,124 |
| 2021 | 2,120 | 2,619 | 2,393 | 1,902 | 1,916 | 1,869 | 2,006 | 2,168 | 2,322 | 2,287 | 2,327 | 2,418 |
| 2022 | 2,456 | 1,996 | 2,307 | 1,906 | 2,017 | 2,148 | 1,918 | 2,060 | 2,037 | 1,926 | 1,917 | 1,740 |
| 2023 | 1,759 | 1,799 | 2,120 | 2,340 | 1,976 | 2,019 | 1,906 | 1,810 | 1,994 | 1,880 | 1,854 | 1,711 |
| 2024 | 1,782 | |||||||||||
| - = No Data Reported; -- = Not Applicable; NA = Not Available; W = Withheld to avoid disclosure of individual company data. |
| Release Date: 3/29/2024 |
| Next Release Date: 4/30/2024 |