|
Download Data (XLS File) |
|
||||||||
|
||||||||
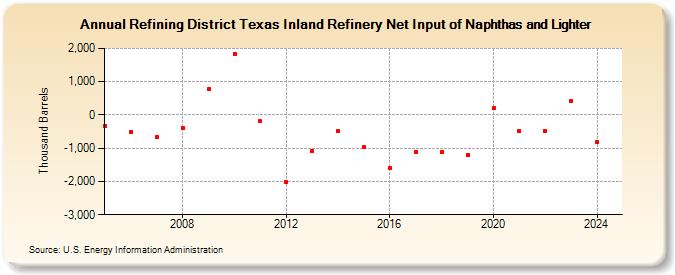
| Refining District Texas Inland Refinery Net Input of Naphthas and Lighter (Thousand Barrels) | ||||||||
| Decade | Year-0 | Year-1 | Year-2 | Year-3 | Year-4 | Year-5 | Year-6 | Year-7 | Year-8 | Year-9 |
|---|---|---|---|---|---|---|---|---|---|---|
| 2000's | -323 | -504 | -670 | -380 | 768 | |||||
| 2010's | 1,827 | -197 | -2,013 | -1,076 | -498 | -972 | -1,585 | -1,116 | -1,104 | -1,201 |
| 2020's | 196 | -469 | -473 | 432 |
| - = No Data Reported; -- = Not Applicable; NA = Not Available; W = Withheld to avoid disclosure of individual company data. |
| Release Date: 3/29/2024 |
| Next Release Date: 8/30/2024 |