|
Download Data (XLS File) |
|
||||||||
|
||||||||
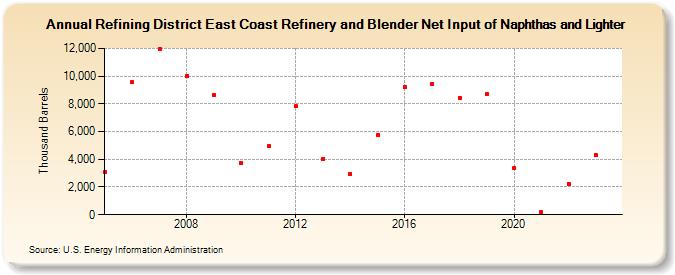
| Refining District East Coast Refinery and Blender Net Input of Naphthas and Lighter (Thousand Barrels) | ||||||||
| Decade | Year-0 | Year-1 | Year-2 | Year-3 | Year-4 | Year-5 | Year-6 | Year-7 | Year-8 | Year-9 |
|---|---|---|---|---|---|---|---|---|---|---|
| 2000's | 3,053 | 9,549 | 11,986 | 10,024 | 8,640 | |||||
| 2010's | 3,730 | 4,965 | 7,824 | 4,022 | 2,929 | 5,780 | 9,201 | 9,459 | 8,442 | 8,690 |
| 2020's | 3,386 | 225 | 2,241 | 4,308 |
| - = No Data Reported; -- = Not Applicable; NA = Not Available; W = Withheld to avoid disclosure of individual company data. |
| Release Date: 6/28/2024 |
| Next Release Date: 8/30/2024 |