|
Download Data (XLS File) |
|
||||||||
|
||||||||
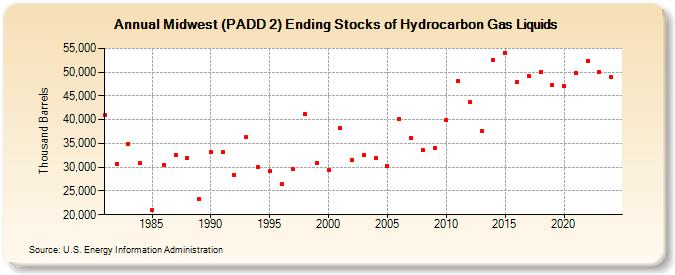
| Midwest (PADD 2) Ending Stocks of Hydrocarbon Gas Liquids (Thousand Barrels) | ||||||||
| Decade | Year-0 | Year-1 | Year-2 | Year-3 | Year-4 | Year-5 | Year-6 | Year-7 | Year-8 | Year-9 |
|---|---|---|---|---|---|---|---|---|---|---|
| 1980's | 41,028 | 30,704 | 34,838 | 30,869 | 20,987 | 30,492 | 32,532 | 31,985 | 23,344 | |
| 1990's | 33,137 | 33,137 | 28,310 | 36,307 | 29,954 | 29,113 | 26,412 | 29,519 | 41,122 | 30,968 |
| 2000's | 29,445 | 38,172 | 31,461 | 32,565 | 31,963 | 30,295 | 40,232 | 36,051 | 33,529 | 34,122 |
| 2010's | 39,862 | 48,189 | 43,693 | 37,678 | 52,551 | 54,064 | 47,937 | 49,254 | 50,099 | 47,299 |
| 2020's | 47,110 | 49,911 | 52,444 | 50,025 |
| - = No Data Reported; -- = Not Applicable; NA = Not Available; W = Withheld to avoid disclosure of individual company data. |
| Release Date: 3/29/2024 |
| Next Release Date: 8/30/2024 |