|
Download Data (XLS File) |
|
||||||||
|
||||||||
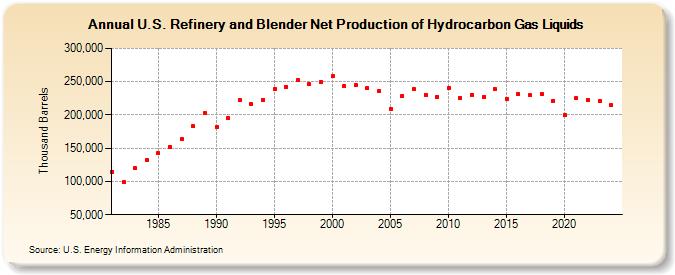
| U.S. Refinery and Blender Net Production of Hydrocarbon Gas Liquids (Thousand Barrels) | ||||||||
| Decade | Year-0 | Year-1 | Year-2 | Year-3 | Year-4 | Year-5 | Year-6 | Year-7 | Year-8 | Year-9 |
|---|---|---|---|---|---|---|---|---|---|---|
| 1980's | 114,802 | 98,528 | 119,613 | 132,700 | 142,642 | 152,312 | 163,703 | 182,611 | 202,225 | |
| 1990's | 182,175 | 195,577 | 222,124 | 215,907 | 223,157 | 238,782 | 242,465 | 252,168 | 245,918 | 249,574 |
| 2000's | 257,984 | 243,322 | 244,900 | 240,082 | 235,975 | 209,029 | 228,960 | 238,904 | 230,431 | 227,470 |
| 2010's | 240,454 | 225,992 | 230,413 | 227,349 | 238,485 | 224,329 | 231,136 | 229,391 | 231,535 | 221,122 |
| 2020's | 199,822 | 225,205 | 223,128 | 220,363 |
| - = No Data Reported; -- = Not Applicable; NA = Not Available; W = Withheld to avoid disclosure of individual company data. |
| Release Date: 8/30/2024 |
| Next Release Date: 8/29/2025 |