|
Download Data (XLS File) |
|
||||||||
|
||||||||
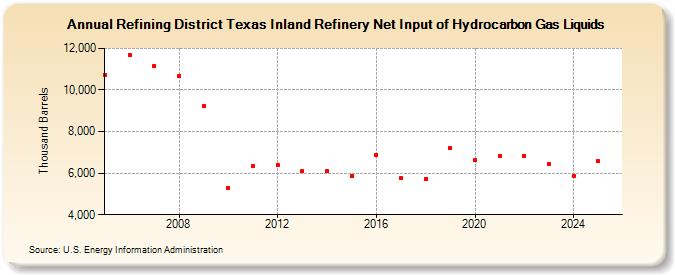
| Refining District Texas Inland Refinery Net Input of Hydrocarbon Gas Liquids (Thousand Barrels) | ||||||||
| Decade | Year-0 | Year-1 | Year-2 | Year-3 | Year-4 | Year-5 | Year-6 | Year-7 | Year-8 | Year-9 |
|---|---|---|---|---|---|---|---|---|---|---|
| 2000's | 10,720 | 11,695 | 11,148 | 10,687 | 9,224 | |||||
| 2010's | 5,277 | 6,325 | 6,368 | 6,083 | 6,079 | 5,885 | 6,873 | 5,744 | 5,719 | 7,222 |
| 2020's | 6,619 | 6,822 | 6,817 | 6,417 |
| - = No Data Reported; -- = Not Applicable; NA = Not Available; W = Withheld to avoid disclosure of individual company data. |
| Release Date: 3/29/2024 |
| Next Release Date: 8/30/2024 |