|
Download Data (XLS File) |
|
||||||||
|
||||||||
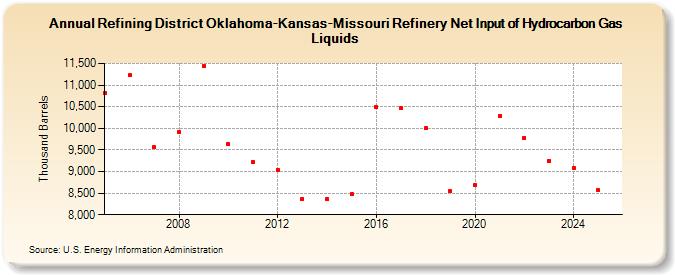
| Refining District Oklahoma-Kansas-Missouri Refinery Net Input of Hydrocarbon Gas Liquids (Thousand Barrels) | ||||||||
| Decade | Year-0 | Year-1 | Year-2 | Year-3 | Year-4 | Year-5 | Year-6 | Year-7 | Year-8 | Year-9 |
|---|---|---|---|---|---|---|---|---|---|---|
| 2000's | 10,807 | 11,225 | 9,559 | 9,919 | 11,438 | |||||
| 2010's | 9,628 | 9,213 | 9,032 | 8,364 | 8,358 | 8,478 | 10,482 | 10,460 | 9,999 | 8,538 |
| 2020's | 8,690 | 10,294 | 9,783 | 9,251 |
| - = No Data Reported; -- = Not Applicable; NA = Not Available; W = Withheld to avoid disclosure of individual company data. |
| Release Date: 3/29/2024 |
| Next Release Date: 8/30/2024 |