|
Download Data (XLS File) |
|
||||||||
|
||||||||
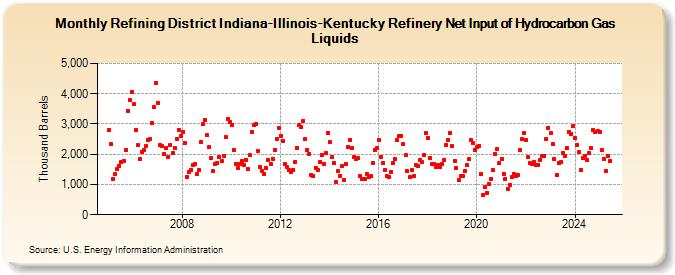
| Refining District Indiana-Illinois-Kentucky Refinery Net Input of Hydrocarbon Gas Liquids (Thousand Barrels) | ||||||||
| Year | Jan | Feb | Mar | Apr | May | Jun | Jul | Aug | Sep | Oct | Nov | Dec |
|---|---|---|---|---|---|---|---|---|---|---|---|---|
| 2005 | 2,816 | 2,338 | 1,196 | 1,348 | 1,501 | 1,616 | 1,742 | 1,783 | 2,133 | 3,432 | 3,805 | 4,071 |
| 2006 | 3,653 | 2,815 | 2,312 | 1,852 | 2,075 | 2,137 | 2,269 | 2,480 | 2,487 | 3,048 | 3,548 | 4,358 |
| 2007 | 3,690 | 2,303 | 2,259 | 2,018 | 2,213 | 1,924 | 2,291 | 2,032 | 2,198 | 2,504 | 2,800 | 2,610 |
| 2008 | 2,739 | 2,373 | 1,262 | 1,404 | 1,493 | 1,632 | 1,674 | 1,332 | 1,473 | 2,407 | 3,010 | 3,128 |
| 2009 | 2,620 | 2,254 | 1,877 | 1,429 | 1,662 | 1,721 | 1,919 | 1,766 | 1,938 | 2,572 | 3,164 | 3,049 |
| 2010 | 2,969 | 2,146 | 1,692 | 1,545 | 1,693 | 1,774 | 1,646 | 1,824 | 1,509 | 1,959 | 2,751 | 2,960 |
| 2011 | 2,986 | 2,093 | 1,586 | 1,443 | 1,333 | 1,529 | 1,798 | 1,677 | 1,845 | 2,155 | 2,518 | 2,869 |
| 2012 | 2,607 | 2,423 | 1,684 | 1,593 | 1,468 | 1,404 | 1,487 | 1,754 | 2,214 | 2,973 | 2,912 | 3,111 |
| 2013 | 2,488 | 2,133 | 2,014 | 1,329 | 1,266 | 1,558 | 1,488 | 1,735 | 1,969 | 1,691 | 2,041 | 2,706 |
| 2014 | 2,403 | 1,915 | 1,712 | 1,095 | 1,441 | 1,292 | 1,595 | 1,145 | 1,669 | 2,250 | 2,478 | 2,190 |
| 2015 | 1,894 | 1,858 | 1,870 | 1,265 | 1,174 | 1,191 | 1,361 | 1,250 | 1,271 | 1,721 | 2,142 | 2,206 |
| 2016 | 2,459 | 1,908 | 1,719 | 1,473 | 1,283 | 1,247 | 1,409 | 1,700 | 1,849 | 2,474 | 2,618 | 2,604 |
| 2017 | 2,331 | 1,963 | 1,443 | 1,238 | 1,479 | 1,270 | 1,644 | 1,620 | 1,819 | 1,733 | 1,969 | 2,691 |
| 2018 | 2,535 | 1,860 | 1,661 | 1,663 | 1,586 | 1,654 | 1,565 | 1,680 | 1,824 | 2,306 | 2,473 | 2,700 |
| 2019 | 2,275 | 1,781 | 1,537 | 1,155 | 1,289 | 1,293 | 1,449 | 1,631 | 1,832 | 2,473 | 2,355 | 2,145 |
| 2020 | 2,229 | 2,282 | 1,346 | 659 | 911 | 728 | 1,028 | 1,196 | 1,464 | 2,022 | 2,160 | 1,696 |
| 2021 | 1,844 | 1,356 | 1,195 | 865 | 993 | 1,232 | 1,348 | 1,266 | 1,321 | 2,145 | 2,495 | 2,696 |
| 2022 | 2,476 | 1,908 | 1,699 | 1,675 | 1,746 | 1,642 | 1,653 | 1,817 | 1,938 | 1,954 | 2,516 | 2,868 |
| 2023 | 2,692 | 2,328 | 1,831 | 1,324 | 1,700 | 1,751 | 2,043 | 1,947 | 2,163 | 2,652 | 2,669 | 2,920 |
| 2024 | 2,514 | |||||||||||
| - = No Data Reported; -- = Not Applicable; NA = Not Available; W = Withheld to avoid disclosure of individual company data. |
| Release Date: 3/29/2024 |
| Next Release Date: 4/30/2024 |