|
Download Data (XLS File) |
|
||||||||
|
||||||||
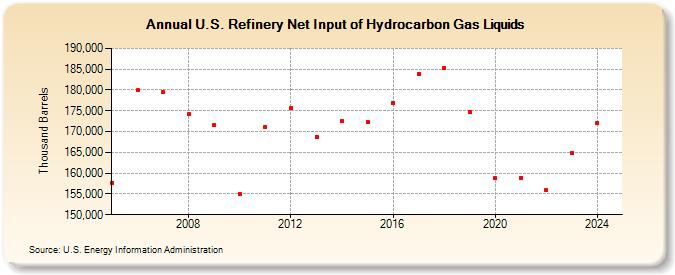
| U.S. Refinery Net Input of Hydrocarbon Gas Liquids (Thousand Barrels) | ||||||||
| Decade | Year-0 | Year-1 | Year-2 | Year-3 | Year-4 | Year-5 | Year-6 | Year-7 | Year-8 | Year-9 |
|---|---|---|---|---|---|---|---|---|---|---|
| 2000's | 157,696 | 179,916 | 179,428 | 174,114 | 171,508 | |||||
| 2010's | 154,941 | 171,074 | 175,607 | 168,808 | 172,563 | 172,400 | 176,980 | 183,951 | 185,218 | 174,684 |
| 2020's | 158,807 | 158,935 | 155,879 | 164,711 |
| - = No Data Reported; -- = Not Applicable; NA = Not Available; W = Withheld to avoid disclosure of individual company data. |
| Release Date: 3/29/2024 |
| Next Release Date: 8/30/2024 |
Referring Pages: