|
Download Data (XLS File) |
|
||||||||
|
||||||||
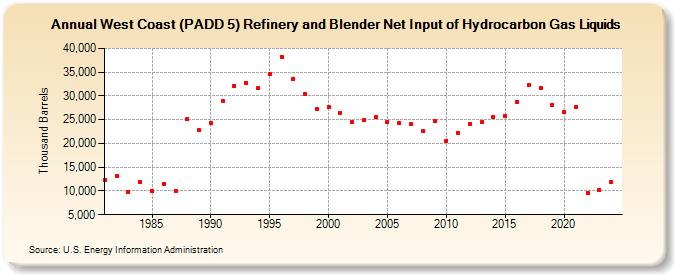
| West Coast (PADD 5) Refinery and Blender Net Input of Hydrocarbon Gas Liquids (Thousand Barrels) | ||||||||
| Decade | Year-0 | Year-1 | Year-2 | Year-3 | Year-4 | Year-5 | Year-6 | Year-7 | Year-8 | Year-9 |
|---|---|---|---|---|---|---|---|---|---|---|
| 1980's | 12,403 | 13,177 | 9,825 | 11,845 | 9,951 | 11,554 | 9,914 | 25,037 | 22,732 | |
| 1990's | 24,270 | 29,008 | 32,112 | 32,772 | 31,647 | 34,585 | 38,251 | 33,571 | 30,395 | 27,145 |
| 2000's | 27,696 | 26,461 | 24,512 | 24,916 | 25,522 | 24,544 | 24,287 | 23,993 | 22,701 | 24,750 |
| 2010's | 20,588 | 22,237 | 24,108 | 24,419 | 25,593 | 25,760 | 28,782 | 32,266 | 31,669 | 28,189 |
| 2020's | 26,564 | 27,744 | 9,669 | 10,213 |
| - = No Data Reported; -- = Not Applicable; NA = Not Available; W = Withheld to avoid disclosure of individual company data. |
| Release Date: 6/28/2024 |
| Next Release Date: 8/30/2024 |