|
Download Data (XLS File) |
|
||||||||
|
||||||||
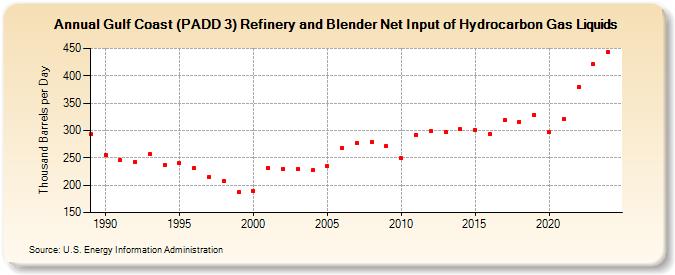
| Gulf Coast (PADD 3) Refinery and Blender Net Input of Hydrocarbon Gas Liquids (Thousand Barrels per Day) | ||||||||
| Decade | Year-0 | Year-1 | Year-2 | Year-3 | Year-4 | Year-5 | Year-6 | Year-7 | Year-8 | Year-9 |
|---|---|---|---|---|---|---|---|---|---|---|
| 1980's | 293 | |||||||||
| 1990's | 256 | 246 | 243 | 257 | 237 | 240 | 231 | 215 | 207 | 187 |
| 2000's | 189 | 232 | 230 | 230 | 227 | 235 | 268 | 278 | 279 | 271 |
| 2010's | 249 | 292 | 299 | 297 | 302 | 301 | 293 | 319 | 316 | 329 |
| 2020's | 297 | 321 | 379 | 421 |
| - = No Data Reported; -- = Not Applicable; NA = Not Available; W = Withheld to avoid disclosure of individual company data. |
| Release Date: 6/28/2024 |
| Next Release Date: 8/30/2024 |