|
Download Data (XLS File) |
|
||||||||
|
||||||||
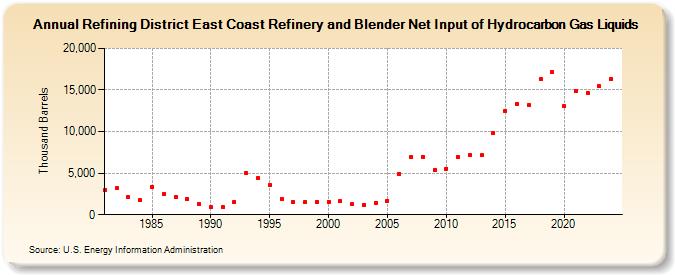
| Refining District East Coast Refinery and Blender Net Input of Hydrocarbon Gas Liquids (Thousand Barrels) | ||||||||
| Decade | Year-0 | Year-1 | Year-2 | Year-3 | Year-4 | Year-5 | Year-6 | Year-7 | Year-8 | Year-9 |
|---|---|---|---|---|---|---|---|---|---|---|
| 1980's | 2,963 | 3,154 | 2,097 | 1,719 | 3,344 | 2,540 | 2,148 | 1,872 | 1,283 | |
| 1990's | 874 | 899 | 1,571 | 5,009 | 4,402 | 3,590 | 1,922 | 1,519 | 1,512 | 1,572 |
| 2000's | 1,579 | 1,590 | 1,241 | 1,217 | 1,466 | 1,693 | 4,938 | 6,929 | 6,998 | 5,362 |
| 2010's | 5,557 | 6,911 | 7,184 | 7,147 | 9,813 | 12,528 | 13,324 | 13,189 | 16,263 | 17,116 |
| 2020's | 13,014 | 14,829 | 14,669 | 15,329 |
| - = No Data Reported; -- = Not Applicable; NA = Not Available; W = Withheld to avoid disclosure of individual company data. |
| Release Date: 6/28/2024 |
| Next Release Date: 8/30/2024 |