|
Download Data (XLS File) |
|
||||||||
|
||||||||
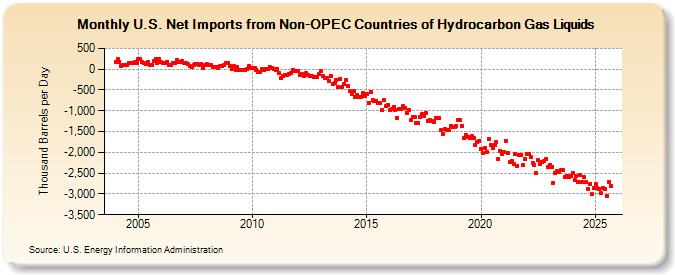
| U.S. Net Imports from Non-OPEC Countries of Hydrocarbon Gas Liquids (Thousand Barrels per Day) | ||||||||
| Year | Jan | Feb | Mar | Apr | May | Jun | Jul | Aug | Sep | Oct | Nov | Dec |
|---|---|---|---|---|---|---|---|---|---|---|---|---|
| 2004 | 176 | 233 | 180 | 80 | 92 | 89 | 98 | 150 | 156 | 143 | 170 | 158 |
| 2005 | 251 | 234 | 161 | 139 | 122 | 173 | 110 | 97 | 191 | 246 | 146 | 239 |
| 2006 | 164 | 144 | 142 | 170 | 106 | 93 | 151 | 154 | 210 | 176 | 165 | 191 |
| 2007 | 141 | 146 | 113 | 65 | 54 | 93 | 130 | 113 | 101 | 134 | 25 | 110 |
| 2008 | 113 | 92 | 93 | 51 | 45 | 62 | 36 | 88 | 77 | 98 | 156 | 159 |
| 2009 | 88 | -2 | 68 | -14 | 49 | -11 | -26 | -31 | -16 | -7 | 72 | 30 |
| 2010 | 37 | 23 | -8 | -61 | -75 | -3 | -17 | 12 | 2 | 44 | 32 | 5 |
| 2011 | -15 | 8 | -87 | -218 | -161 | -148 | -133 | -119 | -93 | -12 | -48 | -45 |
| 2012 | -33 | -142 | -115 | -166 | -88 | -143 | -172 | -159 | -181 | -177 | -178 | -125 |
| 2013 | -32 | -154 | -213 | -217 | -279 | -169 | -362 | -344 | -264 | -433 | -227 | -419 |
| 2014 | -353 | -257 | -402 | -534 | -598 | -532 | -664 | -625 | -664 | -661 | -576 | -643 |
| 2015 | -604 | -803 | -540 | -753 | -773 | -760 | -817 | -825 | -983 | -745 | -893 | -853 |
| 2016 | -991 | -965 | -903 | -989 | -1,177 | -966 | -969 | -885 | -930 | -1,047 | -983 | -1,225 |
| 2017 | -1,146 | -1,162 | -1,288 | -1,293 | -1,152 | -1,073 | -1,118 | -1,042 | -1,240 | -1,230 | -1,255 | -1,261 |
| 2018 | -1,180 | -1,171 | -1,166 | -1,464 | -1,551 | -1,440 | -1,469 | -1,461 | -1,360 | -1,399 | -1,394 | -1,366 |
| 2019 | -1,223 | -1,234 | -1,362 | -1,653 | -1,586 | -1,636 | -1,652 | -1,614 | -1,666 | -1,834 | -1,753 | -1,718 |
| 2020 | -1,912 | -2,022 | -1,899 | -1,992 | -1,668 | -1,833 | -1,888 | -1,812 | -1,756 | -2,172 | -1,963 | -2,033 |
| 2021 | -1,998 | -1,726 | -2,021 | -2,241 | -2,199 | -2,284 | -2,029 | -2,317 | -2,074 | -2,054 | -2,299 | -2,161 |
| 2022 | -2,031 | -2,044 | -2,123 | -2,264 | -2,305 | -2,500 | -2,194 | -2,292 | -2,226 | -2,219 | -2,170 | -2,354 |
| 2023 | -2,324 | -2,418 | -2,628 | -2,477 | -2,277 | -2,387 | -2,354 | -2,353 | -2,538 | -2,485 | -2,610 | -2,606 |
| 2024 | -2,499 | |||||||||||
| - = No Data Reported; -- = Not Applicable; NA = Not Available; W = Withheld to avoid disclosure of individual company data. |
| Release Date: 3/29/2024 |
| Next Release Date: 4/30/2024 |