|
Download Data (XLS File) |
|
||||||||
|
||||||||
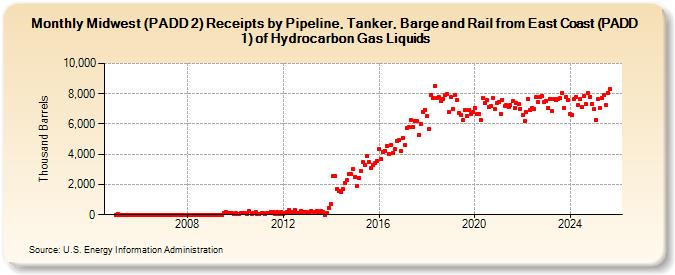
| Midwest (PADD 2) Receipts by Pipeline, Tanker, Barge and Rail from East Coast (PADD 1) of Hydrocarbon Gas Liquids (Thousand Barrels) | ||||||||
| Year | Jan | Feb | Mar | Apr | May | Jun | Jul | Aug | Sep | Oct | Nov | Dec |
|---|---|---|---|---|---|---|---|---|---|---|---|---|
| 2005 | 0 | 75 | 0 | 0 | 0 | 0 | 0 | 0 | 0 | 0 | 0 | 0 |
| 2006 | 0 | 0 | 0 | 0 | 0 | 0 | 0 | 0 | 0 | 0 | 0 | 0 |
| 2007 | 0 | 0 | 0 | 0 | 0 | 0 | 0 | 0 | 0 | 0 | 0 | 0 |
| 2008 | 0 | 0 | 0 | 0 | 0 | 0 | 0 | 0 | 0 | 0 | 0 | 0 |
| 2009 | 0 | 0 | 0 | 0 | 0 | 0 | 138 | 208 | 109 | 137 | 84 | 80 |
| 2010 | 103 | 58 | 40 | 84 | 120 | 105 | 43 | 229 | 66 | 142 | 148 | 55 |
| 2011 | 79 | 89 | 127 | 67 | 123 | 118 | 168 | 200 | 75 | 168 | 58 | 174 |
| 2012 | 74 | 143 | 186 | 302 | 122 | 181 | 312 | 81 | 86 | 273 | 182 | 190 |
| 2013 | 175 | 83 | 258 | 170 | 81 | 231 | 145 | 236 | 166 | 0 | 115 | 473 |
| 2014 | 713 | 2,589 | 2,529 | 1,724 | 1,567 | 1,506 | 1,678 | 2,130 | 2,272 | 2,711 | 2,668 | 3,048 |
| 2015 | 2,470 | 1,905 | 2,460 | 2,880 | 3,467 | 3,272 | 3,907 | 3,491 | 3,071 | 3,314 | 3,395 | 3,556 |
| 2016 | 4,377 | 3,709 | 4,141 | 4,218 | 4,556 | 4,003 | 4,583 | 4,089 | 4,329 | 4,869 | 4,908 | 4,181 |
| 2017 | 5,087 | 4,624 | 5,725 | 5,778 | 6,250 | 5,813 | 6,228 | 6,186 | 5,290 | 6,009 | 6,823 | 6,956 |
| 2018 | 6,500 | 5,642 | 7,898 | 7,721 | 8,542 | 7,715 | 7,799 | 7,511 | 7,681 | 7,894 | 7,965 | 6,793 |
| 2019 | 7,759 | 7,019 | 7,895 | 7,563 | 6,722 | 6,588 | 6,244 | 6,948 | 6,540 | 6,923 | 6,652 | 6,772 |
| 2020 | 7,089 | 6,644 | 6,682 | 6,285 | 7,712 | 7,371 | 7,567 | 7,137 | 7,160 | 7,729 | 6,960 | 7,390 |
| 2021 | 7,464 | 6,658 | 7,604 | 7,167 | 7,227 | 7,103 | 7,271 | 7,497 | 7,033 | 7,394 | 7,295 | 7,001 |
| 2022 | 6,565 | 6,194 | 6,777 | 7,670 | 6,951 | 7,065 | 6,983 | 7,780 | 7,444 | 7,815 | 7,846 | 7,426 |
| 2023 | 7,553 | 7,081 | 7,676 | 6,834 | 7,660 | 7,551 | 7,674 | 7,694 | 8,053 | 7,042 | 7,834 | 7,608 |
| 2024 | 6,601 | |||||||||||
| - = No Data Reported; -- = Not Applicable; NA = Not Available; W = Withheld to avoid disclosure of individual company data. |
| Release Date: 3/29/2024 |
| Next Release Date: 4/30/2024 |