|
Download Data (XLS File) |
|
||||||||
|
||||||||
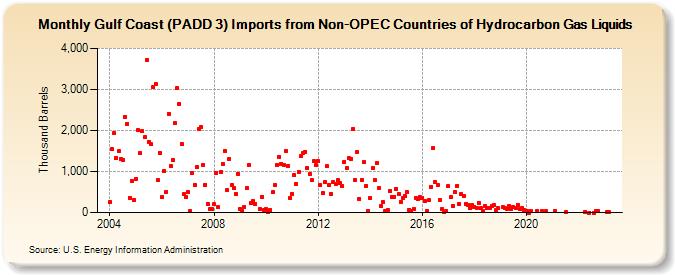
| Gulf Coast (PADD 3) Imports from Non-OPEC Countries of Hydrocarbon Gas Liquids (Thousand Barrels) | ||||||||
| Year | Jan | Feb | Mar | Apr | May | Jun | Jul | Aug | Sep | Oct | Nov | Dec |
|---|---|---|---|---|---|---|---|---|---|---|---|---|
| 2004 | 253 | 1,538 | 1,928 | 1,334 | 1,489 | 1,315 | 1,288 | 2,340 | 2,163 | 361 | 771 | 297 |
| 2005 | 820 | 2,004 | 1,449 | 1,978 | 1,829 | 3,719 | 1,729 | 1,659 | 3,050 | 3,134 | 784 | 1,458 |
| 2006 | 367 | 1,013 | 509 | 2,411 | 1,135 | 1,281 | 2,170 | 3,033 | 2,653 | 1,678 | 447 | 379 |
| 2007 | 495 | 36 | 960 | 677 | 1,099 | 2,042 | 2,075 | 1,164 | 679 | 208 | 84 | 98 |
| 2008 | 197 | 966 | 124 | 980 | 1,184 | 1,512 | 555 | 1,314 | 666 | 596 | 453 | 951 |
| 2009 | 93 | 38 | 133 | 590 | 1,149 | 243 | 270 | 211 | 76 | 389 | 64 | |
| 2010 | 90 | 18 | 60 | 492 | 671 | 1,158 | 1,360 | 1,194 | 1,165 | 1,505 | 1,135 | 358 |
| 2011 | 456 | 919 | 698 | 996 | 1,374 | 1,456 | 1,482 | 1,092 | 946 | 785 | 1,245 | 1,159 |
| 2012 | 1,248 | 671 | 466 | 733 | 1,123 | 680 | 453 | 741 | 691 | 785 | 718 | 653 |
| 2013 | 1,241 | 1,084 | 1,328 | 1,313 | 2,041 | 801 | 1,477 | 333 | 800 | 1,221 | 656 | 34 |
| 2014 | 358 | 1,088 | 793 | 1,213 | 588 | 151 | 249 | 34 | 67 | 527 | 388 | 386 |
| 2015 | 583 | 448 | 267 | 366 | 408 | 494 | 70 | 35 | 88 | 351 | 321 | 368 |
| 2016 | 366 | 287 | 32 | 300 | 630 | 1,565 | 733 | 668 | 312 | 80 | 5 | 44 |
| 2017 | 640 | 372 | 167 | 497 | 657 | 203 | 449 | 407 | 220 | 183 | 115 | 177 |
| 2018 | 145 | 113 | 237 | 103 | 34 | 171 | 112 | 105 | 154 | 173 | 71 | 111 |
| 2019 | 136 | 100 | 97 | 158 | 85 | 130 | 110 | 192 | 76 | 108 | 58 | |
| 2020 | 33 | 0 | 33 | 32 | 33 | 29 | ||||||
| 2021 | 32 | 22 | ||||||||||
| 2022 | 25 | 1 | 1 | 30 | 26 | |||||||
| 2023 | 3 | 6 | ||||||||||
| - = No Data Reported; -- = Not Applicable; NA = Not Available; W = Withheld to avoid disclosure of individual company data. |
| Release Date: 3/29/2024 |
| Next Release Date: 4/30/2024 |