|
Download Data (XLS File) |
|
||||||||
|
||||||||
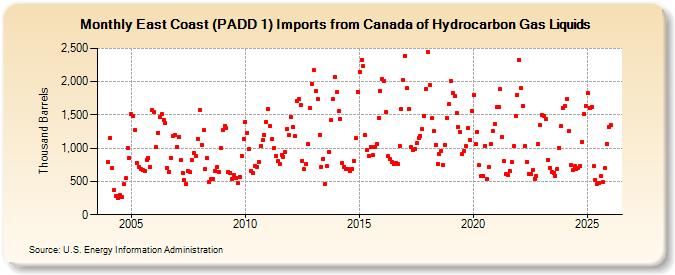
| East Coast (PADD 1) Imports from Canada of Hydrocarbon Gas Liquids (Thousand Barrels) | ||||||||
| Year | Jan | Feb | Mar | Apr | May | Jun | Jul | Aug | Sep | Oct | Nov | Dec |
|---|---|---|---|---|---|---|---|---|---|---|---|---|
| 2004 | 789 | 1,160 | 697 | 371 | 286 | 247 | 297 | 272 | 455 | 549 | 1,008 | 854 |
| 2005 | 1,510 | 1,488 | 1,273 | 781 | 723 | 690 | 673 | 664 | 829 | 858 | 722 | 1,570 |
| 2006 | 1,540 | 1,014 | 1,234 | 1,463 | 1,508 | 1,431 | 1,373 | 703 | 648 | 850 | 1,183 | 1,197 |
| 2007 | 1,024 | 1,166 | 820 | 631 | 519 | 465 | 656 | 635 | 827 | 934 | 876 | 1,140 |
| 2008 | 1,567 | 1,053 | 1,266 | 681 | 851 | 497 | 533 | 537 | 657 | 715 | 647 | 1,004 |
| 2009 | 1,267 | 1,334 | 1,299 | 647 | 628 | 542 | 600 | 556 | 475 | 572 | 887 | 1,142 |
| 2010 | 1,398 | 1,235 | 982 | 663 | 623 | 733 | 722 | 796 | 1,029 | 1,116 | 1,204 | 1,396 |
| 2011 | 1,591 | 1,331 | 1,138 | 999 | 887 | 801 | 756 | 905 | 875 | 945 | 1,293 | 1,191 |
| 2012 | 1,467 | 1,311 | 1,176 | 1,709 | 1,734 | 1,645 | 814 | 682 | 761 | 1,057 | 1,608 | 1,971 |
| 2013 | 2,171 | 1,866 | 1,736 | 1,199 | 720 | 844 | 467 | 727 | 946 | 1,421 | 1,746 | 2,064 |
| 2014 | 1,837 | 1,555 | 1,439 | 779 | 721 | 689 | 688 | 661 | 690 | 814 | 1,148 | 1,849 |
| 2015 | 2,151 | 2,329 | 2,232 | 1,203 | 970 | 887 | 1,023 | 895 | 1,022 | 1,068 | 1,452 | 1,863 |
| 2016 | 2,037 | 2,014 | 1,543 | 885 | 830 | 786 | 759 | 784 | 763 | 1,036 | 1,585 | 2,032 |
| 2017 | 2,390 | 1,899 | 1,584 | 1,019 | 969 | 981 | 1,076 | 1,151 | 1,183 | 1,286 | 1,490 | 1,890 |
| 2018 | 2,444 | 1,950 | 1,448 | 1,255 | 1,054 | 764 | 913 | 951 | 742 | 1,054 | 1,461 | 1,660 |
| 2019 | 2,012 | 1,834 | 1,789 | 1,531 | 1,321 | 1,241 | 911 | 964 | 1,029 | 1,296 | 1,123 | 1,561 |
| 2020 | 1,803 | 1,058 | 1,245 | 741 | 583 | 583 | 1,026 | 543 | 720 | 1,065 | 1,256 | 1,366 |
| 2021 | 1,615 | 1,612 | 1,884 | 1,170 | 801 | 607 | 592 | 656 | 794 | 1,028 | 1,478 | 1,804 |
| 2022 | 2,330 | 1,902 | 1,639 | 1,032 | 797 | 616 | 612 | 678 | 544 | 579 | 1,063 | 1,342 |
| 2023 | 1,465 | 1,442 | 1,409 | 821 | 692 | 629 | 618 | 589 | 689 | 1,010 | 1,328 | 1,598 |
| 2024 | 1,517 | 1,728 | 1,136 | 632 | ||||||||
| - = No Data Reported; -- = Not Applicable; NA = Not Available; W = Withheld to avoid disclosure of individual company data. |
| Release Date: 6/28/2024 |
| Next Release Date: 7/31/2024 |