|
Download Data (XLS File) |
|
||||||||
|
||||||||
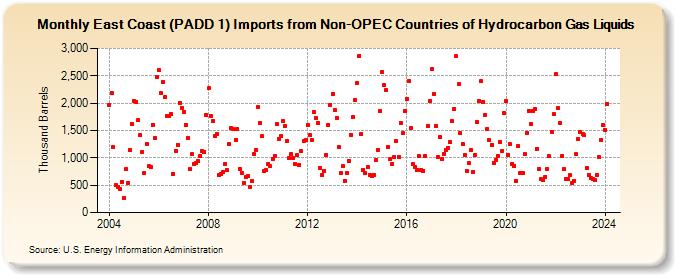
| East Coast (PADD 1) Imports from Non-OPEC Countries of Hydrocarbon Gas Liquids (Thousand Barrels) | ||||||||
| Year | Jan | Feb | Mar | Apr | May | Jun | Jul | Aug | Sep | Oct | Nov | Dec |
|---|---|---|---|---|---|---|---|---|---|---|---|---|
| 2004 | 1,967 | 2,192 | 1,190 | 505 | 473 | 434 | 563 | 272 | 788 | 549 | 1,141 | 1,625 |
| 2005 | 2,045 | 2,025 | 1,685 | 1,417 | 1,109 | 727 | 1,261 | 843 | 829 | 1,607 | 1,358 | 2,479 |
| 2006 | 2,602 | 2,178 | 2,388 | 2,109 | 1,756 | 1,765 | 1,800 | 703 | 1,132 | 1,242 | 2,007 | 1,918 |
| 2007 | 1,844 | 1,609 | 1,371 | 795 | 1,062 | 890 | 897 | 941 | 1,035 | 1,120 | 1,115 | 1,786 |
| 2008 | 2,270 | 1,772 | 1,674 | 1,403 | 1,444 | 678 | 713 | 743 | 882 | 769 | 1,246 | 1,540 |
| 2009 | 1,519 | 1,334 | 1,528 | 793 | 724 | 542 | 641 | 672 | 475 | 572 | 1,071 | 1,142 |
| 2010 | 1,934 | 1,645 | 1,393 | 759 | 777 | 883 | 850 | 983 | 1,029 | 1,615 | 1,340 | 1,396 |
| 2011 | 1,670 | 1,573 | 1,309 | 999 | 1,062 | 991 | 882 | 1,044 | 875 | 1,118 | 1,312 | 1,330 |
| 2012 | 1,606 | 1,412 | 1,321 | 1,840 | 1,734 | 1,645 | 814 | 693 | 761 | 1,057 | 1,608 | 1,971 |
| 2013 | 2,171 | 1,866 | 1,736 | 1,199 | 720 | 844 | 580 | 727 | 946 | 1,422 | 1,746 | 2,064 |
| 2014 | 2,374 | 2,866 | 1,439 | 779 | 722 | 824 | 688 | 661 | 691 | 960 | 1,148 | 1,849 |
| 2015 | 2,570 | 2,330 | 2,234 | 1,203 | 970 | 888 | 1,023 | 1,306 | 1,022 | 1,642 | 1,452 | 1,863 |
| 2016 | 2,080 | 2,413 | 1,543 | 885 | 830 | 786 | 1,028 | 784 | 763 | 1,036 | 1,585 | 2,032 |
| 2017 | 2,627 | 2,173 | 1,584 | 1,019 | 1,388 | 981 | 1,076 | 1,151 | 1,183 | 1,286 | 1,667 | 1,890 |
| 2018 | 2,855 | 2,342 | 1,448 | 1,255 | 1,054 | 764 | 913 | 1,143 | 742 | 1,054 | 1,653 | 2,044 |
| 2019 | 2,395 | 2,026 | 1,789 | 1,531 | 1,321 | 1,241 | 911 | 964 | 1,029 | 1,296 | 1,123 | 1,820 |
| 2020 | 2,037 | 1,058 | 1,245 | 892 | 848 | 583 | 1,218 | 729 | 720 | 1,065 | 1,454 | 1,864 |
| 2021 | 1,615 | 1,865 | 1,884 | 1,170 | 801 | 607 | 592 | 656 | 794 | 1,028 | 1,478 | 1,804 |
| 2022 | 2,526 | 1,902 | 1,639 | 1,032 | 797 | 616 | 612 | 678 | 544 | 580 | 1,063 | 1,344 |
| 2023 | 1,465 | 1,442 | 1,409 | 821 | 692 | 629 | 618 | 589 | 689 | 1,010 | 1,328 | 1,598 |
| 2024 | 1,517 | 1,987 | 1,136 | 632 | ||||||||
| - = No Data Reported; -- = Not Applicable; NA = Not Available; W = Withheld to avoid disclosure of individual company data. |
| Release Date: 6/28/2024 |
| Next Release Date: 7/31/2024 |