|
Download Data (XLS File) |
|
||||||||
|
||||||||
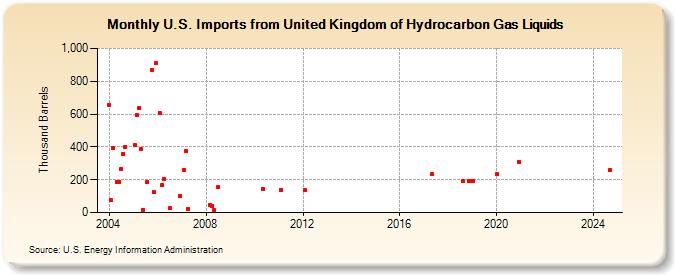
| U.S. Imports from United Kingdom of Hydrocarbon Gas Liquids (Thousand Barrels) | ||||||||
| Year | Jan | Feb | Mar | Apr | May | Jun | Jul | Aug | Sep | Oct | Nov | Dec |
|---|---|---|---|---|---|---|---|---|---|---|---|---|
| 2004 | 657 | 75 | 391 | 187 | 187 | 266 | 357 | 398 | ||||
| 2005 | 409 | 594 | 638 | 386 | 17 | 184 | 871 | 127 | 909 | |||
| 2006 | 608 | 167 | 205 | 27 | 100 | |||||||
| 2007 | 261 | 373 | 24 | |||||||||
| 2008 | 46 | 42 | 16 | 156 | ||||||||
| 2010 | 145 | |||||||||||
| 2011 | 140 | |||||||||||
| 2012 | 135 | |||||||||||
| 2017 | 233 | |||||||||||
| 2018 | 192 | 192 | ||||||||||
| 2019 | 192 | |||||||||||
| 2020 | 234 | 307 | ||||||||||
| - = No Data Reported; -- = Not Applicable; NA = Not Available; W = Withheld to avoid disclosure of individual company data. |
| Release Date: 6/28/2024 |
| Next Release Date: 7/31/2024 |