|
Download Data (XLS File) |
|
||||||||
|
||||||||
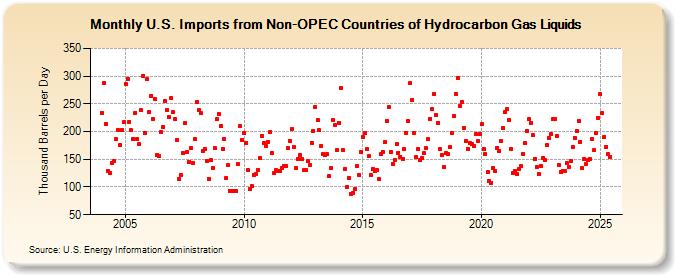
| U.S. Imports from Non-OPEC Countries of Hydrocarbon Gas Liquids (Thousand Barrels per Day) | ||||||||
| Year | Jan | Feb | Mar | Apr | May | Jun | Jul | Aug | Sep | Oct | Nov | Dec |
|---|---|---|---|---|---|---|---|---|---|---|---|---|
| 2004 | 234 | 287 | 214 | 129 | 125 | 144 | 147 | 186 | 202 | 175 | 203 | 217 |
| 2005 | 286 | 295 | 218 | 202 | 187 | 234 | 187 | 177 | 239 | 301 | 198 | 294 |
| 2006 | 236 | 265 | 223 | 259 | 158 | 156 | 200 | 209 | 255 | 239 | 226 | 260 |
| 2007 | 235 | 222 | 185 | 115 | 122 | 162 | 215 | 163 | 145 | 170 | 144 | 187 |
| 2008 | 253 | 238 | 233 | 165 | 168 | 147 | 115 | 148 | 135 | 170 | 222 | 232 |
| 2009 | 210 | 169 | 186 | 117 | 139 | 93 | 93 | 92 | 92 | 141 | 210 | 185 |
| 2010 | 197 | 180 | 130 | 97 | 101 | 122 | 123 | 131 | 152 | 192 | 179 | 174 |
| 2011 | 182 | 200 | 162 | 125 | 130 | 128 | 129 | 134 | 138 | 138 | 170 | 183 |
| 2012 | 205 | 173 | 134 | 151 | 158 | 150 | 130 | 131 | 146 | 140 | 180 | 201 |
| 2013 | 245 | 221 | 202 | 174 | 160 | 157 | 159 | 119 | 134 | 220 | 211 | 167 |
| 2014 | 216 | 278 | 166 | 133 | 100 | 117 | 88 | 90 | 96 | 137 | 121 | 164 |
| 2015 | 191 | 197 | 168 | 156 | 122 | 132 | 129 | 131 | 114 | 159 | 164 | 181 |
| 2016 | 219 | 244 | 163 | 142 | 149 | 177 | 162 | 155 | 151 | 168 | 198 | 219 |
| 2017 | 287 | 257 | 198 | 154 | 169 | 148 | 152 | 161 | 170 | 186 | 223 | 240 |
| 2018 | 268 | 230 | 216 | 168 | 158 | 136 | 161 | 160 | 172 | 197 | 228 | 268 |
| 2019 | 297 | 246 | 254 | 207 | 183 | 169 | 180 | 178 | 174 | 195 | 183 | 196 |
| 2020 | 213 | 169 | 159 | 127 | 110 | 108 | 135 | 128 | 171 | 165 | 183 | 206 |
| 2021 | 235 | 240 | 221 | 168 | 126 | 129 | 123 | 133 | 137 | 160 | 179 | 201 |
| 2022 | 223 | 216 | 193 | 151 | 136 | 123 | 138 | 153 | 148 | 175 | 188 | 195 |
| 2023 | 219 | 220 | 193 | 135 | 127 | 128 | 129 | 143 | 136 | 149 | 173 | 189 |
| 2024 | 192 | |||||||||||
| - = No Data Reported; -- = Not Applicable; NA = Not Available; W = Withheld to avoid disclosure of individual company data. |
| Release Date: 3/29/2024 |
| Next Release Date: 4/30/2024 |