|
Download Data (XLS File) |
|
||||||||
|
||||||||
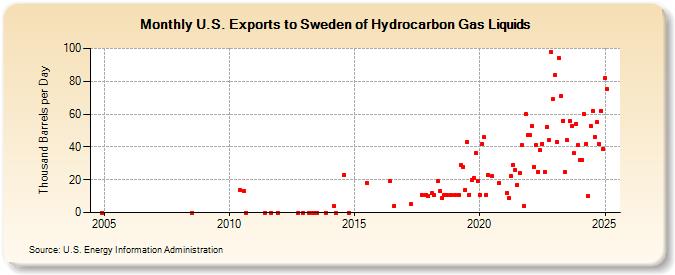
| U.S. Exports to Sweden of Hydrocarbon Gas Liquids (Thousand Barrels per Day) | ||||||||
| Year | Jan | Feb | Mar | Apr | May | Jun | Jul | Aug | Sep | Oct | Nov | Dec |
|---|---|---|---|---|---|---|---|---|---|---|---|---|
| 2004 | 0 | |||||||||||
| 2008 | 0 | |||||||||||
| 2010 | 14 | 13 | 0 | |||||||||
| 2011 | 0 | 0 | 0 | |||||||||
| 2012 | 0 | 0 | ||||||||||
| 2013 | 0 | 0 | 0 | 0 | 0 | |||||||
| 2014 | 4 | 0 | 23 | 0 | ||||||||
| 2015 | 18 | |||||||||||
| 2016 | 19 | 4 | ||||||||||
| 2017 | 5 | 11 | 11 | 10 | ||||||||
| 2018 | 12 | 11 | 19 | 13 | 9 | 11 | 11 | 11 | ||||
| 2019 | 11 | 11 | 29 | 28 | 14 | 43 | 11 | 20 | 21 | 36 | 19 | |
| 2020 | 11 | 42 | 46 | 11 | 23 | 22 | 18 | |||||
| 2021 | 12 | 9 | 22 | 29 | 26 | 17 | 24 | 41 | 4 | 60 | 47 | |
| 2022 | 47 | 53 | 28 | 41 | 25 | 38 | 42 | 25 | 52 | 44 | 98 | 69 |
| 2023 | 90 | 43 | 88 | 75 | 52 | 25 | 44 | 56 | 53 | 36 | 54 | 35 |
| 2024 | 32 | |||||||||||
| - = No Data Reported; -- = Not Applicable; NA = Not Available; W = Withheld to avoid disclosure of individual company data. |
| Release Date: 3/29/2024 |
| Next Release Date: 4/30/2024 |