|
Download Data (XLS File) |
|
||||||||
|
||||||||
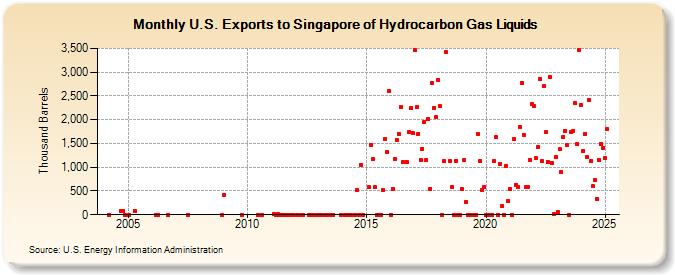
| U.S. Exports to Singapore of Hydrocarbon Gas Liquids (Thousand Barrels) | ||||||||
| Year | Jan | Feb | Mar | Apr | May | Jun | Jul | Aug | Sep | Oct | Nov | Dec |
|---|---|---|---|---|---|---|---|---|---|---|---|---|
| 2004 | 0 | 82 | 82 | 0 | ||||||||
| 2005 | 0 | 82 | ||||||||||
| 2006 | 0 | 1 | 0 | |||||||||
| 2007 | 0 | |||||||||||
| 2008 | 0 | |||||||||||
| 2009 | 413 | 0 | ||||||||||
| 2010 | 0 | 0 | ||||||||||
| 2011 | 9 | 0 | 5 | 1 | 4 | 0 | 2 | 0 | 3 | 0 | 0 | |
| 2012 | 0 | 0 | 0 | 0 | 0 | 0 | 0 | |||||
| 2013 | 0 | 0 | 0 | 0 | 0 | 1 | 3 | |||||
| 2014 | 0 | 0 | 0 | 0 | 0 | 522 | 0 | 1,052 | 0 | |||
| 2015 | 574 | 1,471 | 1,164 | 575 | 0 | 0 | 0 | 525 | 1,598 | 1,319 | 2,606 | |
| 2016 | 0 | 550 | 1,164 | 1,567 | 1,704 | 2,263 | 1,108 | 1,116 | 1,741 | 2,250 | 1,730 | |
| 2017 | 3,470 | 2,266 | 1,703 | 1,157 | 1,389 | 1,951 | 1,154 | 2,023 | 550 | 2,767 | 2,252 | 2,056 |
| 2018 | 2,832 | 2,282 | 0 | 1,125 | 3,420 | 1,124 | 578 | 0 | 1,132 | 0 | 0 | |
| 2019 | 551 | 1,141 | 272 | 0 | 0 | 0 | 1 | 1,699 | 1,125 | 511 | 583 | |
| 2020 | 1 | 0 | 1 | 0 | 1,123 | 1,630 | 0 | 1,077 | 181 | 1 | 1,031 | 291 |
| 2021 | 550 | 0 | 1,596 | 634 | 593 | 1,851 | 2,772 | 1,682 | 586 | 574 | 1,161 | 2,321 |
| 2022 | 2,291 | 1,185 | 1,425 | 2,860 | 1,130 | 2,707 | 1,735 | 1,115 | 2,906 | 1,083 | 7 | 1,212 |
| 2023 | 39 | 1,220 | 12 | 1,430 | 1,770 | 1,136 | 0 | 1,753 | 2,066 | 2,135 | 2,196 | 3,470 |
| 2024 | 2,303 | |||||||||||
| - = No Data Reported; -- = Not Applicable; NA = Not Available; W = Withheld to avoid disclosure of individual company data. |
| Release Date: 3/29/2024 |
| Next Release Date: 4/30/2024 |