|
Download Data (XLS File) |
|
||||||||
|
||||||||
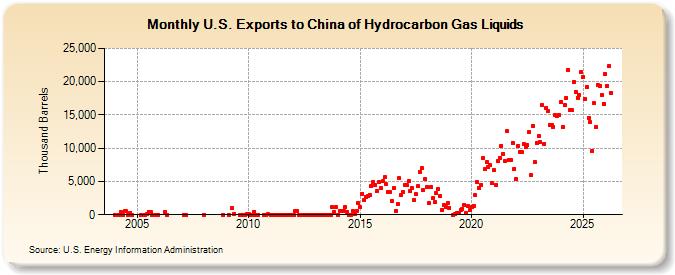
| U.S. Exports to China of Hydrocarbon Gas Liquids (Thousand Barrels) | ||||||||
| Year | Jan | Feb | Mar | Apr | May | Jun | Jul | Aug | Sep | Oct | Nov | Dec |
|---|---|---|---|---|---|---|---|---|---|---|---|---|
| 2004 | 0 | 3 | 478 | 4 | 495 | 511 | 0 | 301 | 0 | |||
| 2005 | 4 | 3 | 33 | 464 | 435 | 1 | 2 | 0 | ||||
| 2006 | 421 | 0 | ||||||||||
| 2007 | 0 | 0 | ||||||||||
| 2008 | 25 | 0 | ||||||||||
| 2009 | 23 | 969 | 46 | 0 | 0 | 0 | 121 | |||||
| 2010 | 58 | 0 | 1 | 455 | 1 | 0 | 0 | 29 | 41 | |||
| 2011 | 0 | 3 | 2 | 3 | 1 | 1 | 6 | 0 | 4 | 2 | 0 | 1 |
| 2012 | 6 | 553 | 550 | 1 | 2 | 0 | 1 | 3 | 1 | 1 | 0 | 0 |
| 2013 | 4 | 0 | 1 | 4 | 3 | 0 | 1 | 0 | 1 | 1,106 | 390 | 1,155 |
| 2014 | 0 | 585 | 577 | 575 | 1,159 | 412 | 0 | 1 | 578 | 53 | 581 | 1,712 |
| 2015 | 1,091 | 3,165 | 2,167 | 2,728 | 2,814 | 2,972 | 4,308 | 4,855 | 4,507 | 3,513 | 4,903 | 4,029 |
| 2016 | 4,997 | 5,614 | 4,547 | 3,479 | 3,394 | 2,029 | 3,987 | 577 | 1,623 | 5,471 | 2,969 | 3,468 |
| 2017 | 4,522 | 4,426 | 5,016 | 3,498 | 4,009 | 2,250 | 3,103 | 4,252 | 6,395 | 6,973 | 3,681 | 5,294 |
| 2018 | 4,137 | 1,731 | 4,198 | 2,453 | 1,861 | 3,282 | 3,825 | 2,780 | 765 | 1,414 | 1,131 | 1,704 |
| 2019 | 1,083 | 1 | 153 | 264 | 262 | 684 | 840 | 1,494 | 267 | 1,353 | 709 | |
| 2020 | 1,144 | 1,383 | 2,920 | 4,886 | 4,038 | 4,536 | 8,450 | 6,823 | 7,900 | 7,188 | 7,429 | 4,722 |
| 2021 | 6,668 | 4,529 | 8,111 | 8,502 | 10,358 | 9,186 | 8,128 | 12,514 | 8,219 | 8,202 | 10,853 | 6,934 |
| 2022 | 5,352 | 10,364 | 9,426 | 9,387 | 10,665 | 10,163 | 10,426 | 12,384 | 5,904 | 13,363 | 7,898 | 10,794 |
| 2023 | 12,037 | 10,285 | 15,423 | 10,824 | 16,060 | 16,729 | 13,245 | 12,576 | 12,810 | 15,011 | 14,775 | 13,804 |
| 2024 | 16,547 | |||||||||||
| - = No Data Reported; -- = Not Applicable; NA = Not Available; W = Withheld to avoid disclosure of individual company data. |
| Release Date: 3/29/2024 |
| Next Release Date: 4/30/2024 |