|
Download Data (XLS File) |
|
||||||||
|
||||||||
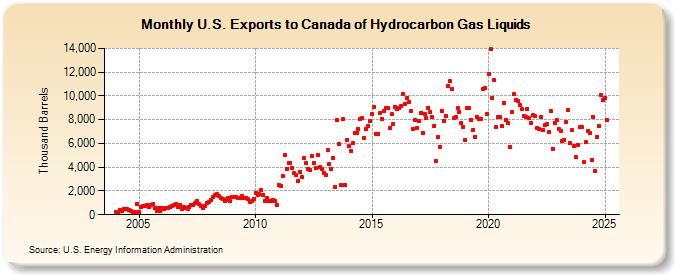
| U.S. Exports to Canada of Hydrocarbon Gas Liquids (Thousand Barrels) | ||||||||
| Year | Jan | Feb | Mar | Apr | May | Jun | Jul | Aug | Sep | Oct | Nov | Dec |
|---|---|---|---|---|---|---|---|---|---|---|---|---|
| 2004 | 238 | 120 | 414 | 348 | 508 | 458 | 459 | 405 | 305 | 233 | 230 | 926 |
| 2005 | 235 | 617 | 735 | 757 | 858 | 675 | 789 | 871 | 530 | 292 | 582 | 331 |
| 2006 | 545 | 501 | 553 | 600 | 671 | 713 | 828 | 892 | 660 | 781 | 484 | 670 |
| 2007 | 544 | 480 | 639 | 845 | 826 | 965 | 1,145 | 880 | 726 | 567 | 721 | 987 |
| 2008 | 1,075 | 1,229 | 1,502 | 1,625 | 1,724 | 1,581 | 1,443 | 1,321 | 1,144 | 1,272 | 1,377 | 1,126 |
| 2009 | 1,492 | 1,451 | 1,453 | 1,409 | 1,388 | 1,580 | 1,431 | 1,439 | 1,286 | 1,106 | 1,166 | 1,311 |
| 2010 | 1,803 | 1,680 | 1,714 | 2,051 | 1,684 | 1,115 | 1,424 | 1,124 | 1,190 | 1,241 | 1,129 | 848 |
| 2011 | 2,531 | 2,448 | 3,299 | 5,030 | 3,855 | 4,366 | 4,353 | 3,958 | 3,482 | 3,308 | 2,824 | 3,628 |
| 2012 | 3,148 | 4,748 | 4,314 | 3,874 | 3,771 | 4,923 | 4,384 | 3,915 | 5,030 | 4,008 | 3,810 | 3,525 |
| 2013 | 3,342 | 5,437 | 4,274 | 3,878 | 4,782 | 2,336 | 7,935 | 5,927 | 2,466 | 8,024 | 2,515 | 6,330 |
| 2014 | 5,776 | 5,343 | 6,015 | 6,902 | 6,894 | 7,204 | 8,081 | 8,131 | 6,435 | 7,192 | 7,463 | 7,929 |
| 2015 | 8,437 | 9,071 | 6,806 | 6,833 | 8,531 | 8,058 | 8,710 | 8,956 | 8,947 | 7,303 | 8,448 | 7,627 |
| 2016 | 9,064 | 8,898 | 8,992 | 9,114 | 10,120 | 9,296 | 9,863 | 9,471 | 8,763 | 7,235 | 7,980 | 7,297 |
| 2017 | 7,915 | 8,596 | 6,886 | 8,498 | 8,117 | 9,022 | 8,628 | 8,190 | 7,501 | 4,527 | 6,535 | 5,730 |
| 2018 | 8,766 | 7,906 | 8,275 | 10,829 | 11,221 | 10,541 | 8,147 | 8,195 | 8,953 | 8,687 | 7,733 | 7,398 |
| 2019 | 6,268 | 8,993 | 9,009 | 8,006 | 7,117 | 6,503 | 8,200 | 8,076 | 8,019 | 10,560 | 10,630 | 8,459 |
| 2020 | 11,878 | 13,918 | 9,866 | 11,315 | 7,367 | 8,265 | 8,263 | 7,457 | 9,403 | 7,993 | 7,695 | 5,729 |
| 2021 | 8,609 | 10,132 | 9,679 | 9,582 | 9,252 | 8,860 | 8,290 | 8,245 | 8,938 | 8,123 | 7,733 | 8,391 |
| 2022 | 8,305 | 7,270 | 7,203 | 8,188 | 7,149 | 7,555 | 7,618 | 6,922 | 8,702 | 5,565 | 7,761 | 7,975 |
| 2023 | 7,046 | 6,613 | 6,136 | 6,342 | 4,080 | 5,546 | 3,998 | 4,248 | 3,388 | 2,495 | 5,857 | 7,235 |
| 2024 | 7,380 | |||||||||||
| - = No Data Reported; -- = Not Applicable; NA = Not Available; W = Withheld to avoid disclosure of individual company data. |
| Release Date: 3/29/2024 |
| Next Release Date: 4/30/2024 |