|
Download Data (XLS File) |
|
||||||||
|
||||||||
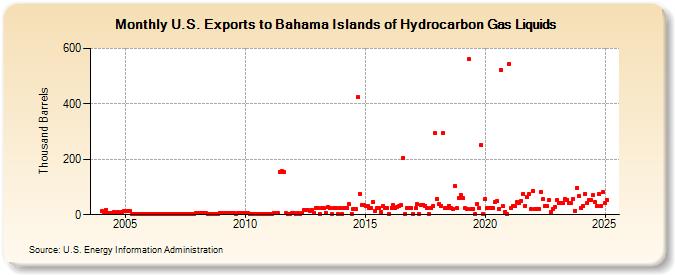
| U.S. Exports to Bahama Islands of Hydrocarbon Gas Liquids (Thousand Barrels) | ||||||||
| Year | Jan | Feb | Mar | Apr | May | Jun | Jul | Aug | Sep | Oct | Nov | Dec |
|---|---|---|---|---|---|---|---|---|---|---|---|---|
| 2004 | 12 | 8 | 18 | 7 | 7 | 7 | 11 | 5 | 8 | 7 | 8 | 13 |
| 2005 | 13 | 13 | 15 | 2 | 1 | 1 | 2 | 1 | 2 | 1 | 2 | 3 |
| 2006 | 3 | 3 | 2 | 1 | 1 | 1 | 1 | 1 | 2 | 1 | 2 | 1 |
| 2007 | 2 | 2 | 2 | 2 | 1 | 1 | 1 | 1 | 1 | 1 | 3 | 5 |
| 2008 | 5 | 6 | 7 | 5 | 6 | 4 | 2 | 3 | 4 | 1 | 4 | 7 |
| 2009 | 7 | 7 | 6 | 7 | 6 | 7 | 6 | 3 | 6 | 6 | 6 | 7 |
| 2010 | 7 | 5 | 1 | 1 | 1 | 1 | 1 | 1 | 1 | 1 | 1 | 1 |
| 2011 | 1 | 4 | 6 | 6 | 5 | 154 | 156 | 153 | 6 | 4 | 3 | 5 |
| 2012 | 7 | 2 | 6 | 4 | 5 | 17 | 16 | 17 | 14 | 17 | 5 | 26 |
| 2013 | 26 | 3 | 24 | 23 | 6 | 27 | 24 | 2 | 23 | 26 | 2 | 25 |
| 2014 | 4 | 26 | 26 | 24 | 37 | 4 | 22 | 22 | 424 | 75 | 36 | 35 |
| 2015 | 32 | 31 | 24 | 25 | 45 | 13 | 26 | 24 | 10 | 32 | 25 | 24 |
| 2016 | 3 | 26 | 34 | 25 | 28 | 31 | 34 | 206 | 2 | 26 | 25 | 24 |
| 2017 | 3 | 25 | 37 | 4 | 35 | 36 | 33 | 24 | 2 | 23 | 33 | 293 |
| 2018 | 57 | 38 | 33 | 294 | 23 | 24 | 33 | 25 | 20 | 103 | 23 | 59 |
| 2019 | 71 | 59 | 23 | 21 | 560 | 22 | 21 | 3 | 40 | 23 | 251 | 2 |
| 2020 | 57 | 26 | 23 | 23 | 23 | 46 | 49 | 22 | 522 | 30 | 11 | 1 |
| 2021 | 545 | 23 | 33 | 31 | 47 | 44 | 51 | 75 | 33 | 64 | 74 | 21 |
| 2022 | 85 | 21 | 22 | 21 | 82 | 55 | 32 | 31 | 53 | 11 | 21 | 28 |
| 2023 | 53 | 43 | 44 | 44 | 57 | 54 | 44 | 44 | 56 | 15 | 98 | 69 |
| 2024 | 23 | |||||||||||
| - = No Data Reported; -- = Not Applicable; NA = Not Available; W = Withheld to avoid disclosure of individual company data. |
| Release Date: 3/29/2024 |
| Next Release Date: 4/30/2024 |