|
Download Data (XLS File) |
|
||||||||
|
||||||||
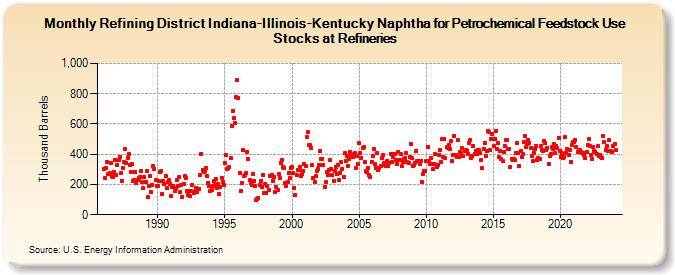
| Refining District Indiana-Illinois-Kentucky Naphtha for Petrochemical Feedstock Use Stocks at Refineries (Thousand Barrels) | ||||||||
| Year | Jan | Feb | Mar | Apr | May | Jun | Jul | Aug | Sep | Oct | Nov | Dec |
|---|---|---|---|---|---|---|---|---|---|---|---|---|
| 1986 | 299 | 243 | 306 | 349 | 270 | 274 | 339 | 256 | 252 | 281 | 362 | 265 |
| 1987 | 329 | 361 | 381 | 275 | 225 | 309 | 350 | 435 | 344 | 376 | 403 | 326 |
| 1988 | 282 | 333 | 222 | 231 | 285 | 211 | 229 | 245 | 252 | 286 | 219 | 176 |
| 1989 | 247 | 219 | 287 | 114 | 192 | 257 | 151 | 196 | 325 | 305 | 227 | 193 |
| 1990 | 188 | 220 | 280 | 289 | 140 | 224 | 204 | 255 | 175 | 215 | 230 | 205 |
| 1991 | 127 | 183 | 193 | 154 | 176 | 227 | 191 | 252 | 151 | 195 | 119 | 202 |
| 1992 | 254 | 243 | 159 | 130 | 155 | 122 | 154 | 194 | 143 | 152 | 174 | 152 |
| 1993 | 170 | 172 | 261 | 404 | 295 | 281 | 287 | 309 | 259 | 213 | 188 | 158 |
| 1994 | 162 | 190 | 224 | 196 | 236 | 176 | 203 | 137 | 184 | 244 | 219 | 199 |
| 1995 | 340 | 394 | 302 | 307 | 316 | 373 | 585 | 688 | 637 | 605 | 778 | 888 |
| 1996 | 773 | 278 | 159 | 209 | 429 | 253 | 261 | 273 | 416 | 370 | 227 | 207 |
| 1997 | 196 | 266 | 223 | 191 | 94 | 106 | 109 | 196 | 225 | 185 | 265 | 144 |
| 1998 | 204 | 144 | 192 | 166 | 256 | 253 | 263 | 226 | 247 | 148 | 180 | 164 |
| 1999 | 268 | 242 | 344 | 361 | 316 | 309 | 209 | 191 | 214 | 273 | 243 | 309 |
| 2000 | 313 | 273 | 177 | 131 | 260 | 297 | 296 | 317 | 253 | 269 | 287 | 334 |
| 2001 | 319 | 512 | 545 | 460 | 460 | 444 | 328 | 240 | 215 | 257 | 288 | 300 |
| 2002 | 332 | 418 | 367 | 371 | 329 | 182 | 219 | 282 | 265 | 298 | 359 | 300 |
| 2003 | 260 | 224 | 286 | 315 | 270 | 330 | 232 | 278 | 350 | 303 | 251 | 407 |
| 2004 | 357 | 391 | 321 | 366 | 414 | 393 | 383 | 400 | 409 | 307 | 388 | 335 |
| 2005 | 472 | 407 | 377 | 438 | 447 | 347 | 286 | 280 | 311 | 260 | 251 | 349 |
| 2006 | 385 | 436 | 337 | 307 | 407 | 295 | 307 | 324 | 376 | 392 | 340 | 330 |
| 2007 | 323 | 354 | 323 | 342 | 402 | 346 | 383 | 402 | 402 | 359 | 337 | 417 |
| 2008 | 363 | 399 | 319 | 349 | 369 | 378 | 409 | 350 | 342 | 382 | 470 | 373 |
| 2009 | 325 | 327 | 345 | 420 | 352 | 353 | 335 | 356 | 218 | 267 | 286 | 292 |
| 2010 | 355 | 451 | 356 | 336 | 374 | 337 | 304 | 334 | 399 | 316 | 329 | 395 |
| 2011 | 431 | 348 | 501 | 381 | 499 | 372 | 445 | 444 | 459 | 432 | 486 | 354 |
| 2012 | 398 | 522 | 395 | 379 | 491 | 381 | 414 | 410 | 440 | 386 | 422 | 429 |
| 2013 | 423 | 400 | 477 | 497 | 375 | 390 | 455 | 401 | 421 | 399 | 427 | 427 |
| 2014 | 405 | 364 | 310 | 435 | 473 | 386 | 421 | 556 | 544 | 426 | 501 | 533 |
| 2015 | 454 | 501 | 556 | 433 | 475 | 380 | 418 | 371 | 357 | 417 | 456 | 492 |
| 2016 | 497 | 435 | 437 | 317 | 371 | 359 | 367 | 360 | 406 | 476 | 406 | 325 |
| 2017 | 419 | 382 | 399 | 480 | 518 | 449 | 466 | 495 | 476 | 438 | 387 | 352 |
| 2018 | 411 | 437 | 455 | 365 | 377 | 366 | 457 | 428 | 421 | 489 | 476 | 427 |
| 2019 | 441 | 334 | 389 | 400 | 447 | 434 | 465 | 409 | 456 | 438 | 508 | 424 |
| 2020 | 382 | 406 | 372 | 379 | 513 | 408 | 434 | 392 | 428 | 347 | 462 | 482 |
| 2021 | 481 | 491 | 449 | 417 | 418 | 426 | 416 | 405 | 409 | 394 | 378 | 412 |
| 2022 | 458 | 498 | 453 | 397 | 371 | 447 | 419 | 416 | 404 | 454 | 389 | 393 |
| 2023 | 380 | 373 | 523 | 479 | 428 | 452 | 421 | 495 | 418 | 420 | 417 | 452 |
| 2024 | 470 | |||||||||||
| - = No Data Reported; -- = Not Applicable; NA = Not Available; W = Withheld to avoid disclosure of individual company data. |
| Release Date: 3/29/2024 |
| Next Release Date: 4/30/2024 |