|
Download Data (XLS File) |
|
||||||||
|
||||||||
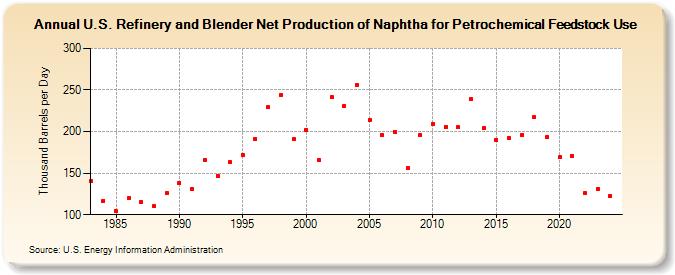
| U.S. Refinery and Blender Net Production of Naphtha for Petrochemical Feedstock Use (Thousand Barrels per Day) | ||||||||
| Decade | Year-0 | Year-1 | Year-2 | Year-3 | Year-4 | Year-5 | Year-6 | Year-7 | Year-8 | Year-9 |
|---|---|---|---|---|---|---|---|---|---|---|
| 1980's | 140 | 117 | 104 | 120 | 115 | 110 | 126 | |||
| 1990's | 138 | 131 | 166 | 147 | 163 | 172 | 191 | 229 | 244 | 191 |
| 2000's | 202 | 166 | 241 | 231 | 256 | 214 | 196 | 200 | 156 | 196 |
| 2010's | 209 | 206 | 205 | 239 | 204 | 190 | 192 | 196 | 217 | 193 |
| 2020's | 169 | 171 | 126 | 131 |
| - = No Data Reported; -- = Not Applicable; NA = Not Available; W = Withheld to avoid disclosure of individual company data. |
| Release Date: 3/29/2024 |
| Next Release Date: 8/30/2024 |