|
Download Data (XLS File) |
|
||||||||
|
||||||||
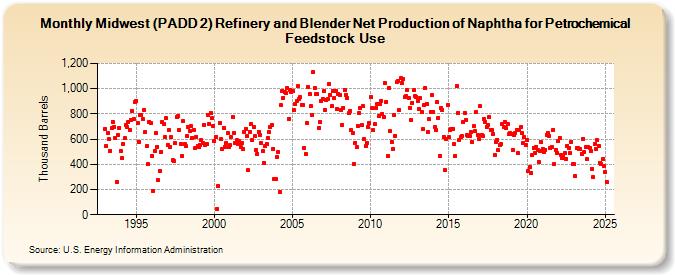
| Midwest (PADD 2) Refinery and Blender Net Production of Naphtha for Petrochemical Feedstock Use (Thousand Barrels) | ||||||||
| Year | Jan | Feb | Mar | Apr | May | Jun | Jul | Aug | Sep | Oct | Nov | Dec |
|---|---|---|---|---|---|---|---|---|---|---|---|---|
| 1993 | 684 | 546 | 645 | 599 | 509 | 687 | 738 | 698 | 607 | 262 | 632 | 691 |
| 1994 | 508 | 450 | 565 | 605 | 713 | 693 | 738 | 674 | 750 | 822 | 758 | 896 |
| 1995 | 906 | 730 | 579 | 789 | 794 | 756 | 833 | 655 | 542 | 401 | 738 | 725 |
| 1996 | 467 | 190 | 506 | 646 | 540 | 273 | 346 | 501 | 734 | 723 | 614 | 765 |
| 1997 | 554 | 672 | 539 | 614 | 432 | 426 | 567 | 778 | 785 | 672 | 564 | 469 |
| 1998 | 740 | 562 | 543 | 624 | 698 | 667 | 701 | 610 | 673 | 526 | 619 | 549 |
| 1999 | 537 | 557 | 591 | 566 | 715 | 553 | 562 | 795 | 723 | 805 | 764 | 704 |
| 2000 | 586 | 620 | 47 | 229 | 729 | 600 | 519 | 690 | 541 | 572 | 645 | 537 |
| 2001 | 552 | 614 | 778 | 651 | 573 | 590 | 565 | 585 | 536 | 572 | 520 | 658 |
| 2002 | 684 | 626 | 351 | 657 | 719 | 589 | 695 | 621 | 515 | 485 | 660 | 629 |
| 2003 | 571 | 503 | 414 | 545 | 564 | 612 | 658 | 699 | 709 | 524 | 283 | 280 |
| 2004 | 457 | 499 | 182 | 868 | 985 | 929 | 975 | 962 | 1,006 | 763 | 990 | 975 |
| 2005 | 984 | 828 | 878 | 902 | 1,018 | 919 | 932 | 873 | 871 | 529 | 482 | 729 |
| 2006 | 1,012 | 959 | 859 | 789 | 1,132 | 1,006 | 955 | 959 | 690 | 737 | 901 | 922 |
| 2007 | 982 | 831 | 911 | 922 | 1,037 | 952 | 859 | 978 | 927 | 982 | 838 | 958 |
| 2008 | 953 | 834 | 712 | 849 | 991 | 952 | 929 | 805 | 822 | 673 | 651 | 406 |
| 2009 | 573 | 534 | 706 | 807 | 846 | 709 | 862 | 598 | 545 | 573 | 696 | 727 |
| 2010 | 936 | 845 | 671 | 716 | 849 | 880 | 783 | 879 | 905 | 802 | 775 | 1,044 |
| 2011 | 897 | 464 | 1,007 | 662 | 580 | 519 | 792 | 627 | 1,050 | 1,063 | 833 | 1,081 |
| 2012 | 1,044 | 1,073 | 931 | 945 | 990 | 927 | 849 | 753 | 890 | 987 | 943 | 937 |
| 2013 | 905 | 837 | 926 | 815 | 678 | 867 | 1,007 | 881 | 657 | 756 | 817 | 946 |
| 2014 | 817 | 698 | 675 | 891 | 770 | 469 | 850 | 831 | 620 | 352 | 602 | 872 |
| 2015 | 615 | 670 | 677 | 684 | 562 | 464 | 1,020 | 809 | 594 | 613 | 626 | 732 |
| 2016 | 810 | 754 | 631 | 621 | 628 | 658 | 578 | 701 | 662 | 816 | 634 | 600 |
| 2017 | 859 | 631 | 621 | 762 | 737 | 697 | 710 | 778 | 672 | 673 | 641 | 471 |
| 2018 | 578 | 593 | 511 | 551 | 560 | 719 | 699 | 735 | 686 | 721 | 637 | 650 |
| 2019 | 643 | 515 | 631 | 648 | 676 | 489 | 669 | 694 | 646 | 572 | 614 | 554 |
| 2020 | 595 | 346 | 380 | 333 | 471 | 532 | 492 | 540 | 514 | 420 | 502 | 574 |
| 2021 | 525 | 500 | 516 | 635 | 650 | 623 | 528 | 541 | 675 | 402 | 517 | 493 |
| 2022 | 582 | 612 | 476 | 447 | 461 | 488 | 446 | 549 | 533 | 493 | 578 | 400 |
| 2023 | 401 | 307 | 529 | 531 | 519 | 520 | 485 | 603 | 498 | 536 | 439 | 534 |
| 2024 | 532 | |||||||||||
| - = No Data Reported; -- = Not Applicable; NA = Not Available; W = Withheld to avoid disclosure of individual company data. |
| Release Date: 3/29/2024 |
| Next Release Date: 4/30/2024 |