|
Download Data (XLS File) |
|
||||||||
|
||||||||
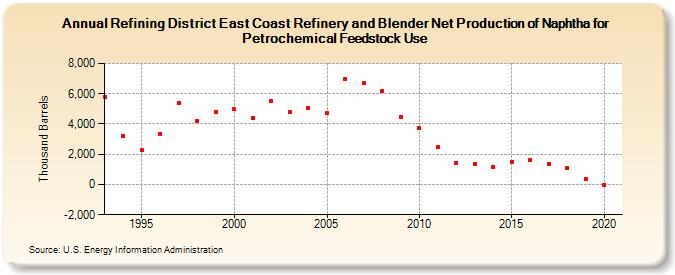
| Refining District East Coast Refinery and Blender Net Production of Naphtha for Petrochemical Feedstock Use (Thousand Barrels) | ||||||||
| Decade | Year-0 | Year-1 | Year-2 | Year-3 | Year-4 | Year-5 | Year-6 | Year-7 | Year-8 | Year-9 |
|---|---|---|---|---|---|---|---|---|---|---|
| 1990's | 5,807 | 3,184 | 2,250 | 3,362 | 5,417 | 4,168 | 4,804 | |||
| 2000's | 4,967 | 4,396 | 5,488 | 4,820 | 5,064 | 4,718 | 6,948 | 6,740 | 6,185 | 4,453 |
| 2010's | 3,719 | 2,445 | 1,444 | 1,360 | 1,176 | 1,505 | 1,640 | 1,381 | 1,105 | 390 |
| 2020's | -5 |
| - = No Data Reported; -- = Not Applicable; NA = Not Available; W = Withheld to avoid disclosure of individual company data. |
| Release Date: 6/30/2025 |
| Next Release Date: 8/29/2025 |