|
Download Data (XLS File) |
|
||||||||
|
||||||||
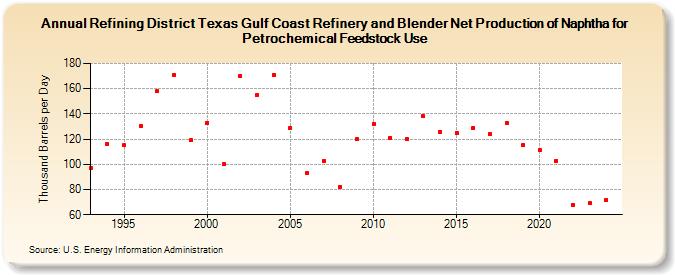
| Refining District Texas Gulf Coast Refinery and Blender Net Production of Naphtha for Petrochemical Feedstock Use (Thousand Barrels per Day) | ||||||||
| Decade | Year-0 | Year-1 | Year-2 | Year-3 | Year-4 | Year-5 | Year-6 | Year-7 | Year-8 | Year-9 |
|---|---|---|---|---|---|---|---|---|---|---|
| 1990's | 97 | 116 | 115 | 130 | 158 | 171 | 119 | |||
| 2000's | 133 | 100 | 170 | 155 | 171 | 129 | 93 | 103 | 82 | 120 |
| 2010's | 132 | 121 | 120 | 138 | 126 | 125 | 129 | 124 | 133 | 115 |
| 2020's | 111 | 103 | 68 | 69 |
| - = No Data Reported; -- = Not Applicable; NA = Not Available; W = Withheld to avoid disclosure of individual company data. |
| Release Date: 3/29/2024 |
| Next Release Date: 8/30/2024 |