|
Download Data (XLS File) |
|
||||||||
|
||||||||
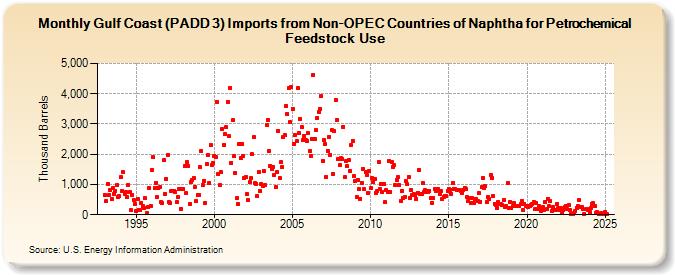
| Gulf Coast (PADD 3) Imports from Non-OPEC Countries of Naphtha for Petrochemical Feedstock Use (Thousand Barrels) | ||||||||
| Year | Jan | Feb | Mar | Apr | May | Jun | Jul | Aug | Sep | Oct | Nov | Dec |
|---|---|---|---|---|---|---|---|---|---|---|---|---|
| 1993 | 645 | 452 | 1,021 | 638 | 816 | 515 | 888 | 698 | 790 | 984 | 579 | 603 |
| 1994 | 1,246 | 798 | 1,399 | 683 | 737 | 589 | 992 | 764 | 146 | 657 | 473 | 348 |
| 1995 | 121 | 519 | 171 | 147 | 393 | 279 | 238 | 539 | 52 | 260 | 891 | 287 |
| 1996 | 1,488 | 1,898 | 880 | 1,062 | 574 | 891 | 914 | 413 | 379 | 1,816 | 697 | 1,186 |
| 1997 | 1,968 | 436 | 403 | 786 | 792 | 797 | 748 | 416 | 602 | 862 | 198 | 854 |
| 1998 | 840 | 1,608 | 716 | 1,731 | 1,605 | 367 | 1,074 | 1,160 | 1,218 | 928 | 442 | 640 |
| 1999 | 665 | 1,570 | 2,113 | 986 | 1,129 | 402 | 1,665 | 1,976 | 1,038 | 2,294 | 1,649 | 1,712 |
| 2000 | 1,934 | 1,907 | 3,720 | 1,332 | 990 | 1,402 | 2,836 | 2,307 | 2,658 | 2,885 | 3,742 | 2,588 |
| 2001 | 4,200 | 1,713 | 3,122 | 1,940 | 1,381 | 538 | 347 | 2,330 | 1,870 | 2,347 | 1,949 | 1,203 |
| 2002 | 1,252 | 671 | 471 | 1,067 | 1,204 | 1,997 | 2,559 | 1,040 | 1,024 | 609 | 1,421 | 792 |
| 2003 | 1,013 | 962 | 1,435 | 990 | 2,974 | 3,137 | 2,112 | 1,618 | 1,514 | 1,586 | 1,316 | 924 |
| 2004 | 1,405 | 2,776 | 1,211 | 1,733 | 1,575 | 2,584 | 2,626 | 3,607 | 3,343 | 4,182 | 3,054 | 4,222 |
| 2005 | 3,507 | 2,350 | 2,642 | 2,427 | 4,176 | 2,718 | 3,159 | 2,906 | 2,458 | 2,614 | 2,466 | 2,443 |
| 2006 | 2,687 | 2,102 | 1,950 | 2,513 | 4,634 | 2,510 | 2,791 | 3,204 | 3,394 | 3,508 | 3,914 | 1,783 |
| 2007 | 2,478 | 2,326 | 1,249 | 2,111 | 2,582 | 1,981 | 2,800 | 1,357 | 2,774 | 3,785 | 3,141 | 1,831 |
| 2008 | 1,632 | 1,869 | 1,852 | 2,903 | 1,241 | 1,761 | 1,610 | 1,803 | 1,449 | 2,309 | 2,446 | 1,275 |
| 2009 | 1,101 | 580 | 1,151 | 846 | 533 | 1,062 | 1,522 | 844 | 1,404 | 1,320 | 713 | 1,435 |
| 2010 | 880 | 1,198 | 1,067 | 1,185 | 727 | 774 | 1,743 | 834 | 1,018 | 753 | 1,023 | 404 |
| 2011 | 808 | 753 | 1,766 | 757 | 1,732 | 1,586 | 1,637 | 977 | 1,152 | 1,240 | 977 | 455 |
| 2012 | 788 | 548 | 581 | 1,106 | 1,011 | 1,252 | 550 | 829 | 652 | 690 | 642 | 532 |
| 2013 | 730 | 1,494 | 701 | 689 | 1,052 | 736 | 805 | 787 | 764 | 785 | 543 | 400 |
| 2014 | 544 | 835 | 795 | 811 | 847 | 698 | 782 | 528 | 586 | 625 | 619 | 774 |
| 2015 | 866 | 832 | 691 | 1,059 | 865 | 835 | 828 | 818 | 816 | 796 | 733 | 820 |
| 2016 | 892 | 843 | 579 | 464 | 560 | 402 | 537 | 396 | 507 | 516 | 455 | 707 |
| 2017 | 433 | 901 | 1,229 | 889 | 938 | 407 | 602 | 517 | 1,314 | 1,219 | 625 | 365 |
| 2018 | 310 | 233 | 421 | 343 | 340 | 306 | 478 | 250 | 291 | 1,044 | 213 | 422 |
| 2019 | 230 | 273 | 371 | 295 | 293 | 283 | 291 | 348 | 458 | 164 | 356 | 300 |
| 2020 | 272 | 245 | 297 | 308 | 345 | 430 | 177 | 377 | 179 | 288 | 186 | 134 |
| 2021 | 241 | 148 | 421 | 184 | 528 | 286 | 444 | 139 | 252 | 143 | 168 | 365 |
| 2022 | 215 | 163 | 211 | 73 | 142 | 246 | 303 | 178 | 308 | 161 | 36 | 24 |
| 2023 | 55 | 121 | 233 | 283 | 497 | 240 | 259 | 179 | 35 | 204 | 156 | |
| 2024 | 75 | |||||||||||
| - = No Data Reported; -- = Not Applicable; NA = Not Available; W = Withheld to avoid disclosure of individual company data. |
| Release Date: 3/29/2024 |
| Next Release Date: 4/30/2024 |