|
Download Data (XLS File) |
|
||||||||
|
||||||||
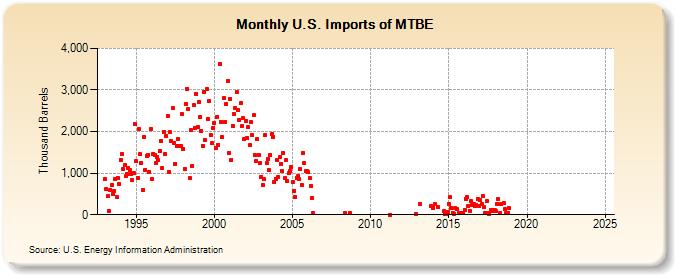
| U.S. Imports of MTBE (Thousand Barrels) | ||||||||
| Year | Jan | Feb | Mar | Apr | May | Jun | Jul | Aug | Sep | Oct | Nov | Dec |
|---|---|---|---|---|---|---|---|---|---|---|---|---|
| 1993 | 848 | 607 | 444 | 101 | 600 | 715 | 494 | 572 | 853 | 426 | 882 | 736 |
| 1994 | 1,325 | 1,470 | 1,089 | 1,190 | 931 | 977 | 1,129 | 1,066 | 974 | 826 | 1,012 | 2,171 |
| 1995 | 1,282 | 893 | 2,067 | 1,458 | 1,249 | 601 | 1,869 | 1,086 | 1,423 | 1,445 | 1,035 | 2,056 |
| 1996 | 850 | 1,464 | 1,444 | 1,240 | 1,386 | 1,304 | 1,526 | 1,776 | 1,129 | 1,995 | 1,450 | 1,898 |
| 1997 | 2,385 | 1,033 | 1,982 | 1,767 | 2,559 | 1,727 | 1,226 | 1,643 | 1,825 | 1,641 | 1,650 | 2,417 |
| 1998 | 1,577 | 1,107 | 2,672 | 3,034 | 2,548 | 887 | 2,035 | 1,177 | 2,632 | 2,075 | 2,912 | 2,101 |
| 1999 | 2,711 | 2,355 | 2,016 | 1,659 | 2,960 | 1,792 | 3,025 | 2,311 | 2,729 | 1,916 | 1,718 | 2,092 |
| 2000 | 2,215 | 1,604 | 2,351 | 1,684 | 3,629 | 2,233 | 1,867 | 2,805 | 2,239 | 2,665 | 3,224 | 1,488 |
| 2001 | 2,794 | 1,327 | 2,140 | 2,427 | 2,565 | 2,941 | 2,524 | 2,289 | 2,676 | 2,132 | 2,323 | 1,822 |
| 2002 | 2,258 | 1,840 | 2,100 | 1,667 | 2,223 | 1,909 | 2,388 | 1,441 | 1,287 | 1,809 | 1,442 | 1,232 |
| 2003 | 916 | 719 | 847 | 1,913 | 1,242 | 1,344 | 1,068 | 1,443 | 1,933 | 1,869 | 783 | 866 |
| 2004 | 1,313 | 909 | 1,376 | 1,227 | 1,049 | 1,489 | 873 | 1,313 | 805 | 996 | 1,046 | 1,145 |
| 2005 | 788 | 575 | 422 | 894 | 926 | 859 | 1,099 | 715 | 1,487 | 1,232 | 1,045 | 1,059 |
| 2006 | 1,028 | 873 | 698 | 402 | 31 | |||||||
| 2008 | 35 | 49 | ||||||||||
| 2011 | 5 | |||||||||||
| 2012 | 7 | |||||||||||
| 2013 | 246 | 207 | ||||||||||
| 2014 | 168 | 261 | 177 | 94 | 16 | 15 | 71 | |||||
| 2015 | 265 | 416 | 160 | 44 | 29 | 163 | 128 | 34 | 31 | 44 | ||
| 2016 | 121 | 387 | 419 | 211 | 101 | 323 | 229 | 248 | 209 | 230 | 378 | 221 |
| 2017 | 351 | 253 | 446 | 177 | 53 | 320 | 44 | 28 | 114 | 87 | 120 | 114 |
| 2018 | 83 | 269 | 376 | 35 | 251 | 275 | 131 | 44 | 41 | 167 | ||
| 2019 | -- | -- | -- | -- | -- | -- | -- | -- | -- | -- | -- | -- |
| 2020 | -- | -- | -- | -- | -- | -- | -- | -- | -- | -- | -- | -- |
| 2021 | -- | -- | -- | -- | -- | -- | -- | -- | -- | -- | -- | |
| 2022 | -- | -- | -- | -- | -- | -- | -- | -- | -- | -- | -- | -- |
| 2023 | -- | -- | -- | -- | -- | -- | -- | -- | -- | -- | -- | -- |
| 2024 | -- | -- | -- | -- | -- | -- | -- | -- | -- | -- | -- | -- |
| 2025 | -- | -- | -- | |||||||||
| - = No Data Reported; -- = Not Applicable; NA = Not Available; W = Withheld to avoid disclosure of individual company data. |
| Release Date: 6/30/2025 |
| Next Release Date: 7/31/2025 |