|
Download Data (XLS File) |
|
||||||||
|
||||||||
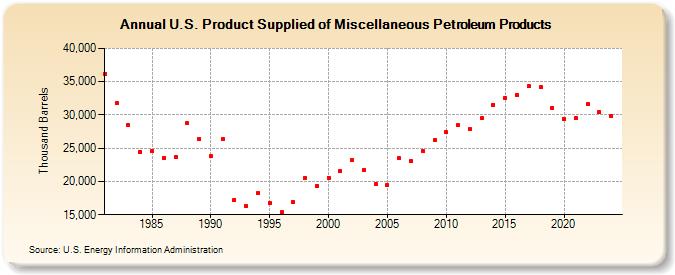
| U.S. Product Supplied of Miscellaneous Petroleum Products (Thousand Barrels) | ||||||||
| Decade | Year-0 | Year-1 | Year-2 | Year-3 | Year-4 | Year-5 | Year-6 | Year-7 | Year-8 | Year-9 |
|---|---|---|---|---|---|---|---|---|---|---|
| 1980's | 36,213 | 31,744 | 28,454 | 24,431 | 24,604 | 23,595 | 23,694 | 28,734 | 26,435 | |
| 1990's | 23,781 | 26,333 | 17,264 | 16,342 | 18,263 | 16,757 | 15,361 | 16,865 | 20,529 | 19,308 |
| 2000's | 20,567 | 21,551 | 23,151 | 21,732 | 19,569 | 19,460 | 23,470 | 23,029 | 24,505 | 26,195 |
| 2010's | 27,381 | 28,423 | 27,878 | 29,531 | 31,529 | 32,596 | 33,013 | 34,301 | 34,156 | 31,083 |
| 2020's | 29,445 | 29,469 | 31,641 | 30,568 |
| - = No Data Reported; -- = Not Applicable; NA = Not Available; W = Withheld to avoid disclosure of individual company data. |
| Release Date: 3/29/2024 |
| Next Release Date: 8/30/2024 |