|
Download Data (XLS File) |
|
||||||||
|
||||||||
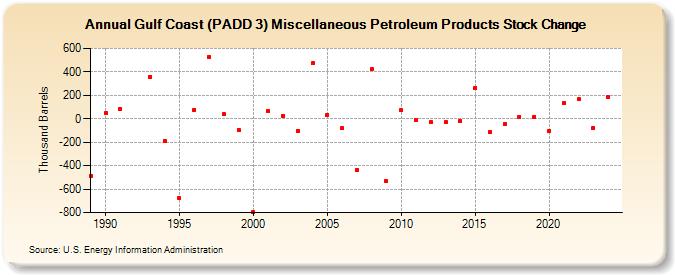
| Gulf Coast (PADD 3) Miscellaneous Petroleum Products Stock Change (Thousand Barrels) | ||||||||
| Decade | Year-0 | Year-1 | Year-2 | Year-3 | Year-4 | Year-5 | Year-6 | Year-7 | Year-8 | Year-9 |
|---|---|---|---|---|---|---|---|---|---|---|
| 1980's | -485 | |||||||||
| 1990's | 49 | 86 | 359 | -189 | -680 | 78 | 530 | 38 | -97 | |
| 2000's | -796 | 68 | 24 | -102 | 473 | 36 | -81 | -434 | 422 | -533 |
| 2010's | 74 | -7 | -30 | -31 | -17 | 265 | -115 | -45 | 15 | 15 |
| 2020's | -106 | 134 | 166 | -77 |
| - = No Data Reported; -- = Not Applicable; NA = Not Available; W = Withheld to avoid disclosure of individual company data. |
| Release Date: 3/29/2024 |
| Next Release Date: 8/30/2024 |