|
Download Data (XLS File) |
|
||||||||
|
||||||||
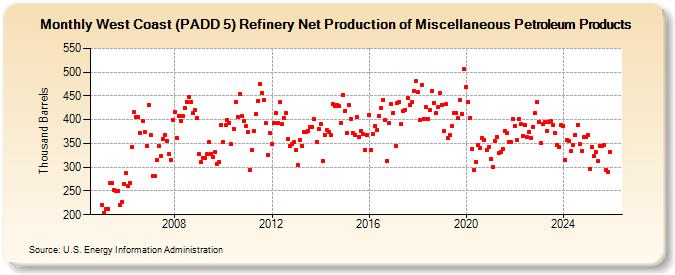
| West Coast (PADD 5) Refinery Net Production of Miscellaneous Petroleum Products (Thousand Barrels) | ||||||||
| Year | Jan | Feb | Mar | Apr | May | Jun | Jul | Aug | Sep | Oct | Nov | Dec |
|---|---|---|---|---|---|---|---|---|---|---|---|---|
| 2005 | 220 | 203 | 213 | 212 | 267 | 266 | 253 | 249 | 250 | 220 | 227 | 265 |
| 2006 | 287 | 261 | 267 | 343 | 417 | 405 | 405 | 372 | 398 | 374 | 345 | 431 |
| 2007 | 367 | 282 | 282 | 315 | 344 | 324 | 359 | 367 | 355 | 328 | 316 | 400 |
| 2008 | 417 | 361 | 408 | 398 | 407 | 425 | 438 | 448 | 438 | 413 | 420 | 403 |
| 2009 | 327 | 310 | 319 | 319 | 327 | 352 | 328 | 321 | 332 | 307 | 310 | 389 |
| 2010 | 352 | 388 | 400 | 393 | 348 | 381 | 437 | 406 | 455 | 407 | 398 | 387 |
| 2011 | 374 | 295 | 337 | 376 | 411 | 439 | 476 | 457 | 441 | 392 | 326 | 371 |
| 2012 | 349 | 393 | 415 | 393 | 437 | 390 | 403 | 415 | 359 | 345 | 348 | 353 |
| 2013 | 336 | 305 | 357 | 345 | 374 | 375 | 377 | 385 | 385 | 401 | 354 | 381 |
| 2014 | 390 | 314 | 368 | 378 | 375 | 368 | 433 | 428 | 430 | 428 | 394 | 451 |
| 2015 | 418 | 372 | 431 | 402 | 373 | 368 | 405 | 364 | 377 | 369 | 337 | 368 |
| 2016 | 410 | 336 | 370 | 387 | 378 | 408 | 424 | 442 | 400 | 314 | 392 | 432 |
| 2017 | 415 | 345 | 435 | 438 | 390 | 418 | 421 | 446 | 431 | 437 | 461 | 481 |
| 2018 | 458 | 400 | 473 | 402 | 426 | 402 | 421 | 461 | 436 | 413 | 427 | 456 |
| 2019 | 431 | 377 | 433 | 361 | 367 | 386 | 414 | 414 | 404 | 441 | 412 | 506 |
| 2020 | 468 | 437 | 404 | 339 | 295 | 310 | 347 | 341 | 362 | 358 | 337 | 343 |
| 2021 | 318 | 301 | 355 | 364 | 329 | 332 | 339 | 376 | 371 | 354 | 352 | 402 |
| 2022 | 387 | 358 | 401 | 390 | 366 | 389 | 364 | 375 | 362 | 385 | 413 | 437 |
| 2023 | 395 | 350 | 390 | 396 | 377 | 396 | 398 | 388 | 371 | 347 | 342 | 389 |
| 2024 | 387 | |||||||||||
| - = No Data Reported; -- = Not Applicable; NA = Not Available; W = Withheld to avoid disclosure of individual company data. |
| Release Date: 3/29/2024 |
| Next Release Date: 4/30/2024 |