|
Download Data (XLS File) |
|
||||||||
|
||||||||
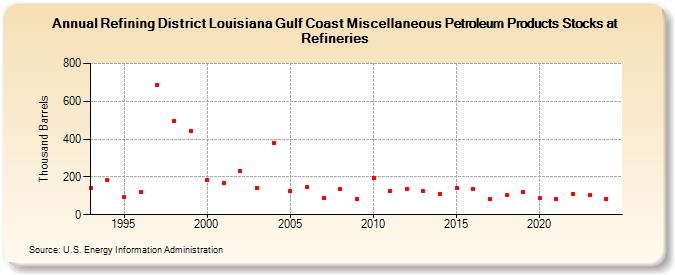
| Refining District Louisiana Gulf Coast Miscellaneous Petroleum Products Stocks at Refineries (Thousand Barrels) | ||||||||
| Decade | Year-0 | Year-1 | Year-2 | Year-3 | Year-4 | Year-5 | Year-6 | Year-7 | Year-8 | Year-9 |
|---|---|---|---|---|---|---|---|---|---|---|
| 1990's | 141 | 186 | 92 | 122 | 684 | 498 | 445 | |||
| 2000's | 186 | 168 | 230 | 140 | 379 | 126 | 144 | 91 | 134 | 84 |
| 2010's | 192 | 127 | 138 | 124 | 111 | 140 | 135 | 83 | 102 | 119 |
| 2020's | 87 | 81 | 112 | 104 |
| - = No Data Reported; -- = Not Applicable; NA = Not Available; W = Withheld to avoid disclosure of individual company data. |
| Release Date: 8/30/2024 |
| Next Release Date: 8/29/2025 |