|
Download Data (XLS File) |
|
||||||||
|
||||||||
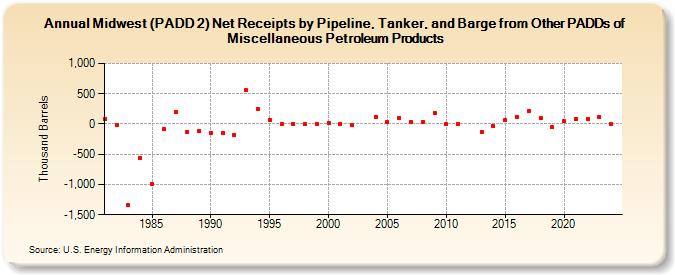
| Midwest (PADD 2) Net Receipts by Pipeline, Tanker, and Barge from Other PADDs of Miscellaneous Petroleum Products (Thousand Barrels) | ||||||||
| Decade | Year-0 | Year-1 | Year-2 | Year-3 | Year-4 | Year-5 | Year-6 | Year-7 | Year-8 | Year-9 |
|---|---|---|---|---|---|---|---|---|---|---|
| 1980's | 89 | -9 | -1,340 | -565 | -989 | -81 | 205 | -136 | -114 | |
| 1990's | -149 | -150 | -178 | 556 | 246 | 58 | 0 | 0 | 0 | 0 |
| 2000's | 20 | 0 | -19 | 109 | 29 | 100 | 34 | 32 | 181 | |
| 2010's | -8 | 5 | -131 | -35 | 58 | 114 | 215 | 92 | -56 | |
| 2020's | 43 | 79 | 90 | 113 |
| - = No Data Reported; -- = Not Applicable; NA = Not Available; W = Withheld to avoid disclosure of individual company data. |
| Release Date: 3/29/2024 |
| Next Release Date: 8/30/2024 |