|
Download Data (XLS File) |
|
||||||||
|
||||||||
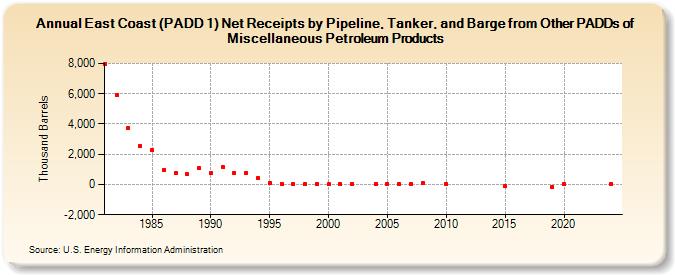
| East Coast (PADD 1) Net Receipts by Pipeline, Tanker, and Barge from Other PADDs of Miscellaneous Petroleum Products (Thousand Barrels) | ||||||||
| Decade | Year-0 | Year-1 | Year-2 | Year-3 | Year-4 | Year-5 | Year-6 | Year-7 | Year-8 | Year-9 |
|---|---|---|---|---|---|---|---|---|---|---|
| 1980's | 7,989 | 5,928 | 3,738 | 2,553 | 2,263 | 975 | 772 | 662 | 1,078 | |
| 1990's | 739 | 1,148 | 769 | 751 | 437 | 73 | 54 | 0 | 0 | 0 |
| 2000's | 0 | 0 | 19 | 11 | 30 | 19 | 39 | 86 | ||
| 2010's | 6 | -88 | -161 | |||||||
| 2020's | 0 |
| - = No Data Reported; -- = Not Applicable; NA = Not Available; W = Withheld to avoid disclosure of individual company data. |
| Release Date: 3/29/2024 |
| Next Release Date: 8/30/2024 |