|
Download Data (XLS File) |
|
||||||||
|
||||||||
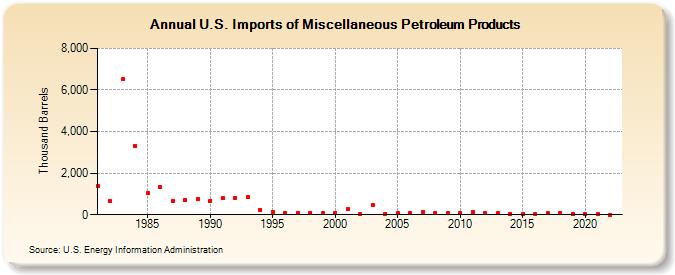
| U.S. Imports of Miscellaneous Petroleum Products (Thousand Barrels) | ||||||||
| Decade | Year-0 | Year-1 | Year-2 | Year-3 | Year-4 | Year-5 | Year-6 | Year-7 | Year-8 | Year-9 |
|---|---|---|---|---|---|---|---|---|---|---|
| 1980's | 1,389 | 657 | 6,505 | 3,325 | 1,031 | 1,313 | 644 | 697 | 748 | |
| 1990's | 676 | 790 | 826 | 848 | 239 | 121 | 106 | 101 | 103 | 63 |
| 2000's | 76 | 267 | 39 | 457 | 49 | 66 | 61 | 119 | 92 | 80 |
| 2010's | 89 | 125 | 74 | 61 | 47 | 16 | 14 | 64 | 97 | 12 |
| 2020's | 14 | 13 | 0 |
| - = No Data Reported; -- = Not Applicable; NA = Not Available; W = Withheld to avoid disclosure of individual company data. |
| Release Date: 3/29/2024 |
| Next Release Date: 8/30/2024 |