|
Download Data (XLS File) |
|
||||||||
|
||||||||
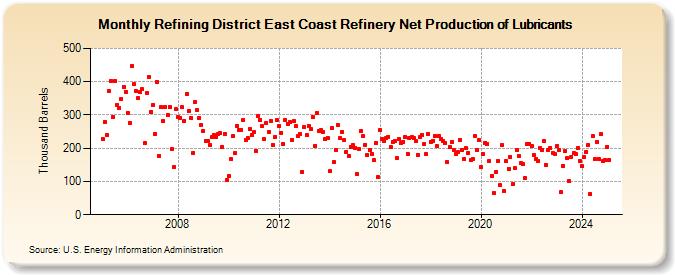
| Refining District East Coast Refinery Net Production of Lubricants (Thousand Barrels) | ||||||||
| Year | Jan | Feb | Mar | Apr | May | Jun | Jul | Aug | Sep | Oct | Nov | Dec |
|---|---|---|---|---|---|---|---|---|---|---|---|---|
| 2005 | 229 | 280 | 240 | 373 | 402 | 294 | 402 | 331 | 322 | 349 | 385 | 370 |
| 2006 | 307 | 277 | 447 | 392 | 373 | 351 | 370 | 377 | 215 | 366 | 414 | 310 |
| 2007 | 330 | 242 | 400 | 178 | 323 | 281 | 325 | 300 | 324 | 198 | 143 | 317 |
| 2008 | 294 | 292 | 323 | 282 | 363 | 312 | 292 | 186 | 338 | 314 | 292 | 269 |
| 2009 | 252 | 221 | 221 | 209 | 234 | 239 | 234 | 242 | 246 | 205 | 243 | 105 |
| 2010 | 115 | 166 | 237 | 185 | 268 | 256 | 255 | 285 | 226 | 232 | 258 | 241 |
| 2011 | 248 | 193 | 296 | 286 | 266 | 227 | 276 | 249 | 283 | 211 | 234 | 285 |
| 2012 | 268 | 247 | 213 | 284 | 274 | 278 | 226 | 281 | 266 | 236 | 243 | 129 |
| 2013 | 264 | 240 | 267 | 258 | 294 | 208 | 306 | 251 | 254 | 248 | 227 | 232 |
| 2014 | 130 | 261 | 159 | 195 | 269 | 230 | 249 | 224 | 190 | 178 | 205 | 209 |
| 2015 | 201 | 121 | 198 | 252 | 237 | 211 | 180 | 196 | 184 | 163 | 215 | 112 |
| 2016 | 255 | 227 | 222 | 230 | 235 | 204 | 218 | 223 | 169 | 227 | 215 | 220 |
| 2017 | 233 | 184 | 230 | 233 | 231 | 222 | 181 | 233 | 240 | 213 | 182 | 243 |
| 2018 | 219 | 223 | 238 | 206 | 238 | 227 | 223 | 216 | 158 | 204 | 218 | 196 |
| 2019 | 184 | 189 | 224 | 195 | 167 | 200 | 186 | 164 | 168 | 236 | 195 | 224 |
| 2020 | 143 | 182 | 217 | 213 | 161 | 117 | 65 | 129 | 162 | 88 | 210 | 72 |
| 2021 | 161 | 138 | 174 | 93 | 139 | 195 | 176 | 154 | 151 | 110 | 212 | 214 |
| 2022 | 206 | 179 | 167 | 161 | 200 | 194 | 223 | 150 | 196 | 201 | 186 | 183 |
| 2023 | 206 | 194 | 67 | 146 | 191 | 170 | 100 | 175 | 185 | 184 | 201 | 162 |
| 2024 | 145 | |||||||||||
| - = No Data Reported; -- = Not Applicable; NA = Not Available; W = Withheld to avoid disclosure of individual company data. |
| Release Date: 3/29/2024 |
| Next Release Date: 4/30/2024 |
Referring Pages: