|
Download Data (XLS File) |
|
||||||||
|
||||||||
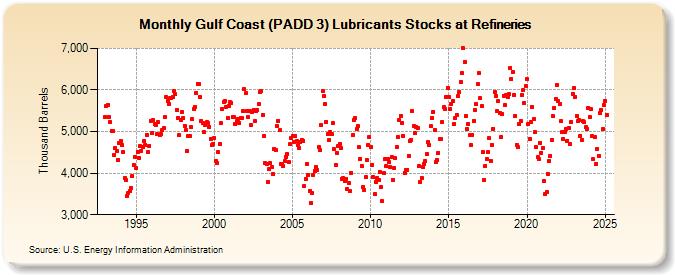
| Gulf Coast (PADD 3) Lubricants Stocks at Refineries (Thousand Barrels) | ||||||||
| Year | Jan | Feb | Mar | Apr | May | Jun | Jul | Aug | Sep | Oct | Nov | Dec |
|---|---|---|---|---|---|---|---|---|---|---|---|---|
| 1993 | 5,348 | 5,621 | 5,650 | 5,349 | 5,226 | 5,024 | 5,018 | 4,439 | 4,607 | 4,542 | 4,322 | 4,730 |
| 1994 | 4,768 | 4,680 | 4,502 | 3,891 | 3,823 | 3,457 | 3,533 | 3,561 | 3,646 | 3,936 | 4,192 | 4,395 |
| 1995 | 4,119 | 4,516 | 4,364 | 4,643 | 4,542 | 4,640 | 4,769 | 4,679 | 4,921 | 4,504 | 4,660 | 5,263 |
| 1996 | 4,955 | 5,271 | 5,182 | 5,169 | 4,930 | 5,225 | 4,919 | 4,941 | 5,033 | 5,076 | 5,346 | 5,835 |
| 1997 | 5,736 | 5,668 | 5,795 | 5,805 | 5,842 | 5,971 | 5,895 | 5,526 | 5,331 | 4,910 | 5,270 | 5,471 |
| 1998 | 5,326 | 5,145 | 5,026 | 4,538 | 4,887 | 4,902 | 5,108 | 5,294 | 5,545 | 5,585 | 5,938 | 6,150 |
| 1999 | 6,139 | 5,825 | 5,261 | 5,211 | 4,983 | 5,168 | 5,219 | 5,195 | 5,107 | 4,832 | 4,669 | 4,702 |
| 2000 | 4,847 | 4,294 | 4,236 | 4,497 | 4,706 | 5,199 | 5,542 | 5,710 | 5,743 | 5,589 | 5,328 | 5,621 |
| 2001 | 5,708 | 5,687 | 5,357 | 5,347 | 5,180 | 5,253 | 5,307 | 5,202 | 5,320 | 5,334 | 5,492 | 6,014 |
| 2002 | 5,924 | 5,496 | 5,349 | 5,494 | 5,165 | 5,466 | 5,529 | 5,243 | 5,493 | 5,510 | 5,666 | 5,963 |
| 2003 | 5,976 | 5,403 | 4,897 | 4,241 | 4,223 | 3,784 | 4,098 | 4,239 | 4,141 | 3,978 | 4,575 | 4,568 |
| 2004 | 5,126 | 5,264 | 5,027 | 4,215 | 4,230 | 4,171 | 4,283 | 4,383 | 4,459 | 4,256 | 4,693 | 4,834 |
| 2005 | 4,891 | 4,749 | 4,898 | 4,767 | 4,669 | 4,603 | 4,759 | 4,807 | 4,781 | 3,687 | 3,859 | 4,225 |
| 2006 | 3,964 | 3,579 | 3,286 | 3,523 | 3,958 | 4,056 | 4,150 | 4,072 | 4,617 | 4,547 | 5,163 | 5,964 |
| 2007 | 5,859 | 5,663 | 5,235 | 4,935 | 4,790 | 4,993 | 4,941 | 5,204 | 4,573 | 4,203 | 4,486 | 4,656 |
| 2008 | 4,711 | 4,600 | 3,868 | 3,881 | 3,819 | 3,852 | 3,623 | 3,773 | 3,560 | 4,008 | 4,919 | 5,284 |
| 2009 | 5,328 | 5,064 | 5,124 | 4,622 | 4,348 | 4,178 | 3,664 | 3,596 | 3,896 | 4,318 | 4,687 | 4,867 |
| 2010 | 4,626 | 4,206 | 3,910 | 3,492 | 3,788 | 3,877 | 3,840 | 4,026 | 3,670 | 3,321 | 3,994 | 4,330 |
| 2011 | 4,161 | 4,335 | 4,264 | 4,137 | 4,387 | 3,844 | 4,133 | 4,354 | 4,635 | 4,865 | 5,282 | 5,381 |
| 2012 | 5,217 | 4,894 | 4,012 | 4,082 | 4,086 | 4,420 | 4,780 | 4,807 | 5,487 | 5,139 | 4,956 | 5,117 |
| 2013 | 5,092 | 4,168 | 3,792 | 3,891 | 4,140 | 4,229 | 4,289 | 4,458 | 4,738 | 4,668 | 5,124 | 5,336 |
| 2014 | 5,479 | 5,039 | 4,267 | 4,311 | 4,496 | 4,810 | 4,821 | 5,232 | 5,582 | 5,547 | 5,825 | 6,055 |
| 2015 | 5,825 | 5,539 | 5,662 | 5,735 | 5,186 | 5,334 | 5,400 | 5,857 | 5,949 | 6,187 | 6,397 | 6,999 |
| 2016 | 6,682 | 5,371 | 5,057 | 5,183 | 4,906 | 4,673 | 4,926 | 5,260 | 5,520 | 5,664 | 6,134 | 6,404 |
| 2017 | 5,806 | 5,614 | 4,501 | 3,840 | 4,178 | 4,345 | 4,499 | 4,833 | 4,302 | 4,678 | 5,072 | 5,959 |
| 2018 | 5,849 | 5,485 | 5,727 | 5,452 | 4,864 | 5,425 | 5,861 | 5,638 | 5,872 | 5,828 | 5,905 | 6,536 |
| 2019 | 6,260 | 6,443 | 5,887 | 5,383 | 4,686 | 4,626 | 5,172 | 5,250 | 5,885 | 5,994 | 5,676 | 6,097 |
| 2020 | 6,261 | 5,180 | 4,826 | 5,233 | 5,599 | 5,297 | 4,980 | 4,618 | 4,376 | 4,331 | 4,732 | 4,491 |
| 2021 | 4,605 | 3,810 | 3,489 | 3,536 | 3,990 | 4,295 | 4,420 | 4,804 | 5,369 | 5,562 | 5,784 | 6,122 |
| 2022 | 5,724 | 5,652 | 5,243 | 4,988 | 4,819 | 4,979 | 5,063 | 4,780 | 5,089 | 4,706 | 5,234 | 5,914 |
| 2023 | 6,053 | 5,833 | 5,372 | 5,253 | 5,277 | 4,900 | 4,799 | 5,242 | 5,223 | 5,102 | 5,072 | 5,576 |
| 2024 | 5,340 | |||||||||||
| - = No Data Reported; -- = Not Applicable; NA = Not Available; W = Withheld to avoid disclosure of individual company data. |
| Release Date: 3/29/2024 |
| Next Release Date: 4/30/2024 |