|
Download Data (XLS File) |
|
||||||||
|
||||||||
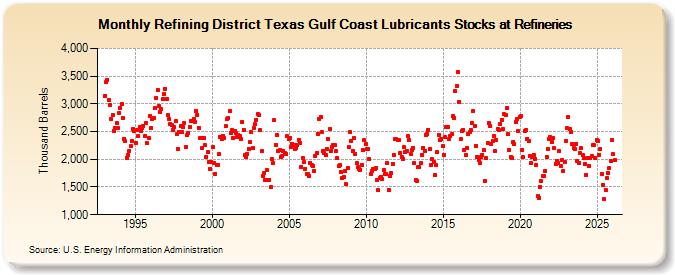
| Refining District Texas Gulf Coast Lubricants Stocks at Refineries (Thousand Barrels) | ||||||||
| Year | Jan | Feb | Mar | Apr | May | Jun | Jul | Aug | Sep | Oct | Nov | Dec |
|---|---|---|---|---|---|---|---|---|---|---|---|---|
| 1993 | 3,147 | 3,392 | 3,430 | 3,073 | 2,971 | 2,733 | 2,804 | 2,513 | 2,570 | 2,650 | 2,566 | 2,840 |
| 1994 | 2,932 | 2,991 | 2,747 | 2,373 | 2,325 | 2,028 | 2,080 | 2,155 | 2,233 | 2,328 | 2,540 | 2,508 |
| 1995 | 2,301 | 2,519 | 2,411 | 2,591 | 2,518 | 2,563 | 2,593 | 2,416 | 2,651 | 2,286 | 2,386 | 2,783 |
| 1996 | 2,565 | 2,729 | 2,747 | 2,927 | 3,099 | 3,254 | 2,952 | 2,851 | 2,901 | 3,080 | 3,178 | 3,276 |
| 1997 | 3,090 | 2,793 | 2,730 | 2,632 | 2,615 | 2,530 | 2,582 | 2,684 | 2,451 | 2,189 | 2,500 | 2,599 |
| 1998 | 2,490 | 2,580 | 2,657 | 2,230 | 2,433 | 2,482 | 2,588 | 2,696 | 2,696 | 2,726 | 2,678 | 2,877 |
| 1999 | 2,804 | 2,573 | 2,376 | 2,392 | 2,209 | 2,389 | 2,252 | 2,049 | 2,125 | 1,953 | 1,833 | 1,957 |
| 2000 | 2,218 | 1,934 | 1,741 | 1,903 | 1,896 | 2,091 | 2,403 | 2,363 | 2,422 | 2,379 | 2,592 | 2,724 |
| 2001 | 2,742 | 2,869 | 2,477 | 2,521 | 2,390 | 2,507 | 2,477 | 2,393 | 2,437 | 2,412 | 2,367 | 2,681 |
| 2002 | 2,532 | 2,075 | 2,036 | 2,097 | 2,194 | 2,310 | 2,483 | 2,206 | 2,557 | 2,630 | 2,714 | 2,814 |
| 2003 | 2,805 | 2,523 | 2,143 | 1,700 | 1,756 | 1,625 | 1,803 | 1,625 | 1,632 | 1,498 | 2,007 | 1,926 |
| 2004 | 2,703 | 2,265 | 2,435 | 2,144 | 2,167 | 2,043 | 2,059 | 2,141 | 2,122 | 2,102 | 2,411 | 2,364 |
| 2005 | 2,389 | 2,224 | 2,281 | 2,254 | 2,186 | 2,200 | 2,257 | 2,354 | 2,302 | 1,868 | 2,022 | 1,942 |
| 2006 | 1,831 | 1,735 | 1,735 | 1,707 | 1,934 | 1,889 | 1,882 | 1,792 | 2,062 | 2,121 | 2,461 | 2,735 |
| 2007 | 2,765 | 2,483 | 2,153 | 2,108 | 2,079 | 2,183 | 2,357 | 2,546 | 2,148 | 2,215 | 2,264 | 2,264 |
| 2008 | 2,153 | 2,014 | 1,873 | 1,889 | 1,762 | 1,664 | 1,684 | 1,785 | 1,549 | 1,841 | 2,214 | 2,487 |
| 2009 | 2,330 | 2,155 | 2,389 | 2,100 | 1,932 | 1,852 | 1,831 | 1,813 | 1,902 | 2,162 | 2,342 | 2,270 |
| 2010 | 2,178 | 2,188 | 2,002 | 1,729 | 1,781 | 1,833 | 1,823 | 1,840 | 1,620 | 1,442 | 1,659 | 1,686 |
| 2011 | 1,639 | 1,805 | 1,731 | 1,734 | 1,927 | 1,443 | 1,704 | 1,756 | 1,921 | 2,082 | 2,357 | 2,363 |
| 2012 | 2,348 | 2,344 | 2,118 | 2,044 | 2,009 | 2,216 | 2,126 | 2,155 | 2,415 | 2,342 | 2,091 | 2,167 |
| 2013 | 2,212 | 1,932 | 1,635 | 1,600 | 1,854 | 1,855 | 1,928 | 2,086 | 2,207 | 2,150 | 2,438 | 2,462 |
| 2014 | 2,536 | 2,192 | 1,897 | 1,998 | 1,959 | 1,713 | 1,900 | 2,134 | 2,438 | 2,343 | 2,373 | 2,237 |
| 2015 | 2,085 | 2,396 | 2,579 | 2,589 | 2,365 | 2,428 | 2,448 | 2,772 | 2,747 | 3,225 | 3,326 | 3,578 |
| 2016 | 3,040 | 2,358 | 2,505 | 2,534 | 2,171 | 2,078 | 2,212 | 2,456 | 2,493 | 2,524 | 2,648 | 2,867 |
| 2017 | 2,596 | 2,245 | 2,034 | 1,989 | 1,935 | 2,042 | 2,082 | 2,167 | 1,614 | 2,015 | 2,290 | 2,654 |
| 2018 | 2,599 | 2,269 | 2,326 | 2,421 | 2,151 | 2,342 | 2,548 | 2,520 | 2,628 | 2,715 | 2,547 | 2,814 |
| 2019 | 2,807 | 2,922 | 2,450 | 2,165 | 2,042 | 2,031 | 2,309 | 2,279 | 2,679 | 2,724 | 2,504 | 2,766 |
| 2020 | 2,774 | 2,171 | 2,038 | 2,511 | 2,525 | 2,373 | 2,332 | 2,060 | 1,932 | 2,037 | 2,086 | 2,008 |
| 2021 | 1,903 | 1,332 | 1,301 | 1,502 | 1,611 | 1,690 | 1,700 | 1,788 | 2,048 | 2,179 | 2,360 | 2,401 |
| 2022 | 2,304 | 2,385 | 2,198 | 1,918 | 1,966 | 1,940 | 2,148 | 1,883 | 1,988 | 1,790 | 1,951 | 2,331 |
| 2023 | 2,557 | 2,762 | 2,549 | 2,494 | 2,279 | 2,201 | 2,187 | 2,278 | 1,962 | 1,931 | 2,107 | 2,201 |
| 2024 | 2,077 | |||||||||||
| - = No Data Reported; -- = Not Applicable; NA = Not Available; W = Withheld to avoid disclosure of individual company data. |
| Release Date: 3/29/2024 |
| Next Release Date: 4/30/2024 |
Referring Pages: