|
Download Data (XLS File) |
|
||||||||
|
||||||||
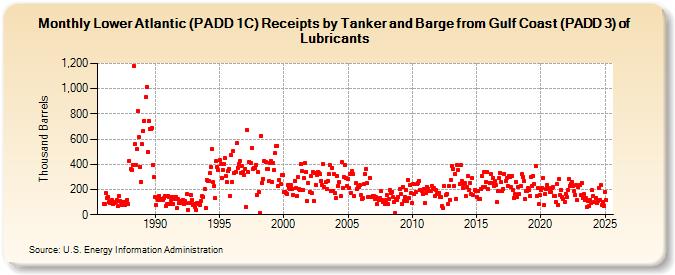
| Lower Atlantic (PADD 1C) Receipts by Tanker and Barge from Gulf Coast (PADD 3) of Lubricants (Thousand Barrels) | ||||||||
| Year | Jan | Feb | Mar | Apr | May | Jun | Jul | Aug | Sep | Oct | Nov | Dec |
|---|---|---|---|---|---|---|---|---|---|---|---|---|
| 1986 | 86 | 84 | 171 | 131 | 144 | 98 | 94 | 107 | 114 | 83 | 91 | 103 |
| 1987 | 114 | 67 | 145 | 110 | 100 | 77 | 96 | 104 | 79 | 94 | 120 | 87 |
| 1988 | 428 | 363 | 358 | 393 | 1,181 | 559 | 398 | 521 | 821 | 613 | 380 | 258 |
| 1989 | 558 | 667 | 745 | 931 | 1,013 | 498 | 746 | 683 | 681 | 691 | 398 | 299 |
| 1990 | 142 | 77 | 130 | 113 | 151 | 128 | 117 | 117 | 132 | 148 | 72 | 82 |
| 1991 | 150 | 138 | 84 | 110 | 143 | 86 | 124 | 143 | 51 | 122 | 89 | 102 |
| 1992 | 107 | 89 | 120 | 82 | 107 | 89 | 163 | 38 | 93 | 159 | 119 | 79 |
| 1993 | 88 | 63 | 38 | 91 | 90 | 88 | 80 | 109 | 145 | 143 | 202 | 56 |
| 1994 | 275 | 264 | 270 | 330 | 378 | 522 | 256 | 226 | 132 | 428 | 380 | 352 |
| 1995 | 432 | 401 | 291 | 358 | 402 | 447 | 309 | 258 | 343 | 363 | 152 | 470 |
| 1996 | 260 | 505 | 332 | 339 | 567 | 372 | 402 | 426 | 333 | 385 | 335 | 312 |
| 1997 | 363 | 62 | 671 | 335 | 421 | 407 | 532 | 364 | 373 | 371 | 398 | 160 |
| 1998 | 337 | 179 | 14 | 628 | 253 | 284 | 430 | 417 | 361 | 365 | 264 | 411 |
| 1999 | 428 | 261 | 411 | 357 | 489 | 543 | 546 | 227 | 278 | 240 | 315 | 313 |
| 2000 | 181 | 183 | 175 | 166 | 238 | 209 | 208 | 233 | 208 | 159 | 270 | 209 |
| 2001 | 149 | 297 | 203 | 193 | 403 | 346 | 199 | 288 | 409 | 341 | 107 | 255 |
| 2002 | 181 | 305 | 170 | 342 | 109 | 332 | 235 | 318 | 340 | 331 | 320 | 270 |
| 2003 | 239 | 402 | 218 | 256 | 208 | 266 | 320 | 395 | 186 | 373 | 191 | 322 |
| 2004 | 170 | 129 | 309 | 231 | 257 | 146 | 416 | 215 | 300 | 391 | 289 | 224 |
| 2005 | 287 | 214 | 326 | 174 | 344 | 325 | 150 | 249 | 203 | 219 | 218 | 233 |
| 2006 | 155 | 127 | 131 | 242 | 320 | 364 | 251 | 142 | 295 | 144 | 144 | 151 |
| 2007 | 149 | 121 | 140 | 82 | 128 | 118 | 135 | 185 | 116 | 97 | 83 | 116 |
| 2008 | 159 | 87 | 123 | 198 | 173 | 178 | 137 | 102 | 14 | 121 | 113 | 139 |
| 2009 | 202 | 166 | 84 | 222 | 109 | 140 | 197 | 111 | 276 | 134 | 235 | 169 |
| 2010 | 92 | 246 | 161 | 182 | 243 | 253 | 271 | 194 | 194 | 186 | 164 | 206 |
| 2011 | 93 | 174 | 222 | 206 | 189 | 186 | 228 | 203 | 209 | 146 | 194 | 167 |
| 2012 | 174 | 176 | 137 | 137 | 68 | 50 | 227 | 153 | 168 | 84 | 231 | 120 |
| 2013 | 276 | 390 | 361 | 228 | 322 | 127 | 396 | 351 | 245 | 394 | 266 | 211 |
| 2014 | 244 | 249 | 146 | 219 | 305 | 200 | 251 | 166 | 289 | 159 | 199 | 188 |
| 2015 | 144 | 190 | 123 | 125 | 207 | 311 | 216 | 342 | 223 | 263 | 337 | 201 |
| 2016 | 255 | 322 | 251 | 291 | 230 | 269 | 238 | 98 | 187 | 291 | 333 | 256 |
| 2017 | 187 | 206 | 327 | 269 | 290 | 230 | 307 | 299 | 217 | 305 | 197 | 134 |
| 2018 | 161 | 260 | 138 | 222 | 164 | 228 | 320 | 298 | 270 | 123 | 190 | 185 |
| 2019 | 210 | 194 | 152 | 303 | 229 | 306 | 243 | 385 | 149 | 209 | 83 | 158 |
| 2020 | 193 | 213 | 293 | 79 | 166 | 201 | 237 | 209 | 181 | 177 | 214 | 219 |
| 2021 | 151 | 152 | 102 | 245 | 81 | 286 | 155 | 195 | 142 | 123 | 104 | 167 |
| 2022 | 140 | 194 | 282 | 231 | 243 | 261 | 227 | 186 | 155 | 236 | 114 | 219 |
| 2023 | 235 | 153 | 255 | 131 | 162 | 113 | 130 | 62 | 109 | 69 | 117 | 90 |
| 2024 | 194 | |||||||||||
| - = No Data Reported; -- = Not Applicable; NA = Not Available; W = Withheld to avoid disclosure of individual company data. |
| Release Date: 3/29/2024 |
| Next Release Date: 4/30/2024 |