|
Download Data (XLS File) |
|
||||||||
|
||||||||
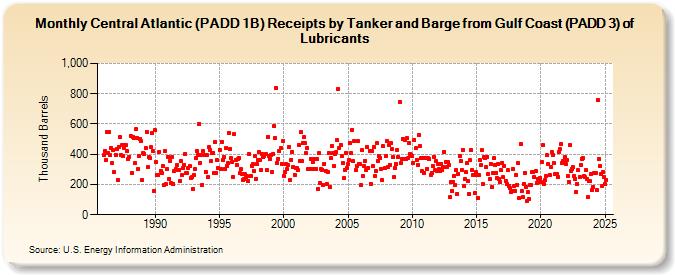
| Central Atlantic (PADD 1B) Receipts by Tanker and Barge from Gulf Coast (PADD 3) of Lubricants (Thousand Barrels) | ||||||||
| Year | Jan | Feb | Mar | Apr | May | Jun | Jul | Aug | Sep | Oct | Nov | Dec |
|---|---|---|---|---|---|---|---|---|---|---|---|---|
| 1986 | 396 | 423 | 360 | 545 | 411 | 550 | 393 | 438 | 339 | 426 | 283 | 396 |
| 1987 | 436 | 229 | 449 | 513 | 395 | 458 | 391 | 439 | 459 | 459 | 420 | 371 |
| 1988 | 382 | 521 | 278 | 514 | 507 | 340 | 565 | 508 | 302 | 387 | 500 | 485 |
| 1989 | 228 | 411 | 404 | 443 | 549 | 313 | 383 | 377 | 446 | 538 | 418 | 156 |
| 1990 | 557 | 347 | 260 | 263 | 416 | 290 | 276 | 319 | 194 | 419 | 203 | 304 |
| 1991 | 384 | 238 | 356 | 207 | 383 | 204 | 288 | 299 | 328 | 293 | 298 | 225 |
| 1992 | 355 | 260 | 309 | 331 | 404 | 274 | 273 | 310 | 320 | 240 | 250 | 170 |
| 1993 | 263 | 302 | 375 | 419 | 395 | 603 | 344 | 395 | 199 | 419 | 392 | 285 |
| 1994 | 395 | 248 | 446 | 429 | 352 | 406 | 409 | 274 | 481 | 273 | 360 | 310 |
| 1995 | 430 | 302 | 482 | 363 | 380 | 301 | 440 | 324 | 340 | 543 | 437 | 372 |
| 1996 | 347 | 252 | 532 | 364 | 326 | 367 | 378 | 273 | 301 | 272 | 230 | 236 |
| 1997 | 266 | 247 | 253 | 221 | 400 | 258 | 323 | 333 | 290 | 386 | 238 | 334 |
| 1998 | 365 | 412 | 363 | 298 | 402 | 382 | 389 | 400 | 297 | 516 | 391 | 366 |
| 1999 | 398 | 284 | 404 | 588 | 507 | 839 | 344 | 371 | 420 | 439 | 337 | 485 |
| 2000 | 255 | 282 | 334 | 299 | 326 | 450 | 228 | 364 | 417 | 314 | 263 | 310 |
| 2001 | 307 | 294 | 460 | 356 | 545 | 353 | 476 | 513 | 472 | 406 | 444 | 304 |
| 2002 | 301 | 369 | 305 | 347 | 371 | 304 | 304 | 370 | 173 | 406 | 209 | 301 |
| 2003 | 298 | 198 | 336 | 291 | 204 | 284 | 410 | 181 | 374 | 456 | 409 | 323 |
| 2004 | 402 | 416 | 491 | 830 | 443 | 463 | 388 | 342 | 242 | 298 | 410 | 312 |
| 2005 | 334 | 364 | 475 | 405 | 561 | 353 | 490 | 294 | 324 | 485 | 337 | 334 |
| 2006 | 195 | 427 | 257 | 319 | 354 | 297 | 447 | 312 | 423 | 205 | 422 | 320 |
| 2007 | 447 | 255 | 288 | 473 | 358 | 385 | 373 | 305 | 228 | 452 | 307 | 386 |
| 2008 | 488 | 315 | 458 | 330 | 474 | 434 | 381 | 247 | 311 | 334 | 431 | 381 |
| 2009 | 746 | 345 | 370 | 501 | 369 | 491 | 369 | 506 | 373 | 476 | 402 | 394 |
| 2010 | 385 | 342 | 497 | 439 | 363 | 332 | 527 | 454 | 374 | 286 | 376 | 278 |
| 2011 | 373 | 375 | 304 | 376 | 366 | 263 | 275 | 324 | 384 | 294 | 354 | 292 |
| 2012 | 334 | 301 | 292 | 338 | 294 | 318 | 417 | 349 | 314 | 348 | 332 | 114 |
| 2013 | 218 | 159 | 218 | 258 | 195 | 297 | 137 | 271 | 390 | 358 | 295 | 430 |
| 2014 | 189 | 234 | 280 | 340 | 223 | 139 | 359 | 426 | 293 | 262 | 142 | 281 |
| 2015 | 265 | 113 | 260 | 363 | 326 | 425 | 206 | 382 | 374 | 313 | 384 | 271 |
| 2016 | 237 | 336 | 183 | 276 | 374 | 328 | 275 | 243 | 335 | 236 | 215 | 294 |
| 2017 | 344 | 247 | 325 | 225 | 205 | 293 | 189 | 179 | 151 | 158 | 304 | 190 |
| 2018 | 157 | 263 | 199 | 341 | 108 | 468 | 157 | 115 | 204 | 279 | 186 | 91 |
| 2019 | 151 | 102 | 199 | 197 | 282 | 285 | 247 | 286 | 212 | 237 | 218 | 242 |
| 2020 | 219 | 347 | 459 | 203 | 227 | 259 | 392 | 335 | 264 | 316 | 416 | 397 |
| 2021 | 341 | 269 | 270 | 268 | 250 | 417 | 432 | 466 | 343 | 357 | 379 | 336 |
| 2022 | 362 | 253 | 218 | 458 | 292 | 303 | 314 | 255 | 238 | 153 | 202 | 293 |
| 2023 | 251 | 330 | 371 | 377 | 254 | 247 | 295 | 239 | 114 | 226 | 220 | 272 |
| 2024 | 164 | |||||||||||
| - = No Data Reported; -- = Not Applicable; NA = Not Available; W = Withheld to avoid disclosure of individual company data. |
| Release Date: 3/29/2024 |
| Next Release Date: 4/30/2024 |