|
Download Data (XLS File) |
|
||||||||
|
||||||||
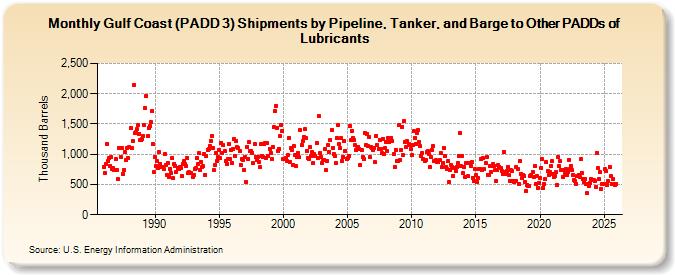
| Gulf Coast (PADD 3) Shipments by Pipeline, Tanker, and Barge to Other PADDs of Lubricants (Thousand Barrels) | ||||||||
| Year | Jan | Feb | Mar | Apr | May | Jun | Jul | Aug | Sep | Oct | Nov | Dec |
|---|---|---|---|---|---|---|---|---|---|---|---|---|
| 1986 | 797 | 685 | 842 | 1,169 | 880 | 931 | 809 | 958 | 751 | 771 | 741 | 916 |
| 1987 | 740 | 584 | 1,105 | 1,099 | 959 | 1,106 | 670 | 746 | 1,037 | 897 | 1,103 | 936 |
| 1988 | 1,119 | 1,438 | 1,099 | 1,217 | 2,145 | 1,350 | 1,366 | 1,416 | 1,476 | 1,341 | 1,239 | 1,237 |
| 1989 | 1,248 | 1,305 | 1,477 | 1,757 | 1,961 | 1,299 | 1,435 | 1,470 | 1,526 | 1,713 | 1,162 | 708 |
| 1990 | 962 | 809 | 880 | 767 | 1,034 | 846 | 787 | 792 | 754 | 1,004 | 825 | 664 |
| 1991 | 855 | 631 | 759 | 691 | 941 | 606 | 844 | 811 | 706 | 765 | 756 | 792 |
| 1992 | 766 | 648 | 844 | 891 | 835 | 802 | 943 | 682 | 699 | 691 | 691 | 620 |
| 1993 | 654 | 752 | 780 | 937 | 841 | 1,013 | 747 | 877 | 796 | 800 | 1,009 | 663 |
| 1994 | 969 | 1,077 | 1,094 | 1,134 | 1,224 | 1,309 | 1,108 | 732 | 816 | 1,024 | 890 | 946 |
| 1995 | 1,067 | 942 | 1,192 | 1,016 | 1,152 | 1,051 | 896 | 845 | 920 | 1,172 | 923 | 1,073 |
| 1996 | 857 | 1,088 | 1,251 | 976 | 1,212 | 1,113 | 1,105 | 1,052 | 826 | 924 | 902 | 743 |
| 1997 | 952 | 542 | 1,123 | 926 | 1,206 | 1,048 | 1,045 | 1,026 | 854 | 1,171 | 955 | 912 |
| 1998 | 956 | 871 | 782 | 1,168 | 975 | 959 | 1,177 | 1,185 | 943 | 1,188 | 970 | 1,087 |
| 1999 | 1,028 | 919 | 1,127 | 1,446 | 1,708 | 1,803 | 1,435 | 1,056 | 1,089 | 1,304 | 1,491 | 1,389 |
| 2000 | 917 | 928 | 932 | 893 | 979 | 1,272 | 875 | 1,101 | 1,071 | 830 | 1,130 | 981 |
| 2001 | 799 | 958 | 1,018 | 947 | 1,400 | 1,156 | 1,222 | 1,292 | 1,410 | 1,266 | 1,054 | 940 |
| 2002 | 924 | 1,118 | 966 | 1,034 | 847 | 998 | 975 | 1,190 | 931 | 1,626 | 1,014 | 958 |
| 2003 | 852 | 909 | 911 | 1,090 | 738 | 896 | 1,148 | 1,040 | 1,234 | 1,405 | 1,104 | 1,003 |
| 2004 | 977 | 853 | 1,274 | 1,483 | 1,165 | 1,095 | 1,266 | 885 | 960 | 1,216 | 1,059 | 929 |
| 2005 | 937 | 970 | 1,460 | 1,230 | 1,390 | 1,269 | 1,232 | 1,146 | 1,068 | 1,083 | 1,126 | 1,090 |
| 2006 | 825 | 1,066 | 949 | 916 | 1,358 | 1,151 | 1,341 | 1,130 | 1,286 | 947 | 1,118 | 1,106 |
| 2007 | 1,072 | 1,111 | 866 | 1,305 | 1,160 | 1,089 | 1,238 | 1,091 | 1,017 | 1,256 | 1,002 | 1,101 |
| 2008 | 1,196 | 1,053 | 1,265 | 1,195 | 1,230 | 1,269 | 1,223 | 1,002 | 790 | 1,076 | 881 | 896 |
| 2009 | 1,482 | 910 | 1,076 | 1,457 | 994 | 1,550 | 1,207 | 1,124 | 1,216 | 1,172 | 1,146 | 1,086 |
| 2010 | 982 | 1,151 | 1,382 | 1,275 | 1,176 | 1,348 | 1,400 | 1,209 | 1,128 | 969 | 1,023 | 919 |
| 2011 | 890 | 897 | 1,038 | 1,045 | 997 | 794 | 946 | 1,064 | 1,131 | 895 | 895 | 899 |
| 2012 | 871 | 879 | 897 | 1,027 | 784 | 859 | 1,107 | 964 | 793 | 763 | 894 | 546 |
| 2013 | 731 | 823 | 793 | 642 | 779 | 730 | 787 | 854 | 976 | 1,352 | 799 | 977 |
| 2014 | 685 | 792 | 621 | 857 | 854 | 632 | 850 | 813 | 869 | 615 | 563 | 755 |
| 2015 | 650 | 542 | 611 | 757 | 753 | 914 | 747 | 930 | 750 | 854 | 952 | 663 |
| 2016 | 664 | 808 | 706 | 813 | 832 | 803 | 737 | 553 | 732 | 818 | 793 | 774 |
| 2017 | 727 | 665 | 1,044 | 706 | 668 | 719 | 791 | 651 | 554 | 731 | 729 | 552 |
| 2018 | 533 | 781 | 554 | 752 | 510 | 891 | 680 | 606 | 661 | 640 | 547 | 391 |
| 2019 | 499 | 469 | 479 | 645 | 660 | 709 | 630 | 805 | 507 | 641 | 447 | 522 |
| 2020 | 605 | 778 | 914 | 446 | 505 | 590 | 867 | 717 | 653 | 703 | 807 | 882 |
| 2021 | 672 | 630 | 643 | 709 | 497 | 958 | 799 | 883 | 734 | 629 | 740 | 675 |
| 2022 | 756 | 649 | 698 | 911 | 763 | 812 | 731 | 661 | 582 | 550 | 514 | 646 |
| 2023 | 663 | 631 | 919 | 692 | 588 | 540 | 587 | 514 | 352 | 503 | 467 | 521 |
| 2024 | 588 | |||||||||||
| - = No Data Reported; -- = Not Applicable; NA = Not Available; W = Withheld to avoid disclosure of individual company data. |
| Release Date: 3/29/2024 |
| Next Release Date: 4/30/2024 |