|
Download Data (XLS File) |
|
||||||||
|
||||||||
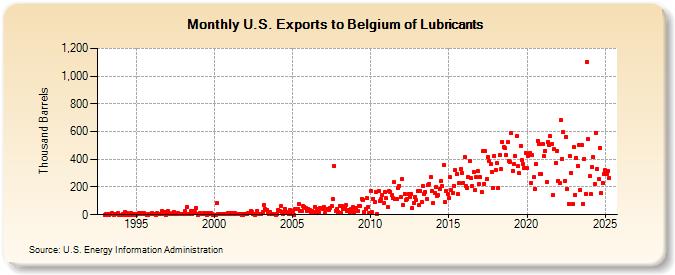
| U.S. Exports to Belgium of Lubricants (Thousand Barrels) | ||||||||
| Year | Jan | Feb | Mar | Apr | May | Jun | Jul | Aug | Sep | Oct | Nov | Dec |
|---|---|---|---|---|---|---|---|---|---|---|---|---|
| 1993 | 0 | 8 | 8 | 1 | 6 | 12 | 3 | 1 | 8 | 2 | 9 | 1 |
| 1994 | 1 | 1 | 2 | 18 | 1 | 9 | 1 | 1 | 10 | 1 | 8 | 2 |
| 1995 | 1 | 2 | 10 | 3 | 9 | 3 | 10 | 6 | 1 | 1 | 2 | 4 |
| 1996 | 9 | 4 | 3 | 1 | 9 | 3 | 3 | 3 | 26 | 3 | 23 | 1 |
| 1997 | 26 | 10 | 4 | 2 | 10 | 19 | 4 | 2 | 11 | 5 | 2 | 3 |
| 1998 | 5 | 25 | 3 | 54 | 8 | 3 | 24 | 2 | 26 | 17 | 50 | 1 |
| 1999 | 7 | 9 | 8 | 7 | 15 | 9 | 1 | 9 | 3 | 9 | 2 | 1 |
| 2000 | 1 | 1 | 84 | 3 | 3 | 2 | 3 | 3 | 5 | 2 | 10 | 3 |
| 2001 | 2 | 9 | 10 | 2 | 9 | 3 | 2 | 3 | 3 | 1 | 1 | 2 |
| 2002 | 2 | 2 | 13 | 10 | 27 | 20 | 5 | 1 | 2 | 28 | 2 | 2 |
| 2003 | 4 | 18 | 70 | 43 | 37 | 17 | 3 | 21 | 4 | 2 | 3 | 1 |
| 2004 | 3 | 37 | 25 | 60 | 19 | 6 | 42 | 20 | 16 | 3 | 34 | 6 |
| 2005 | 25 | 1 | 42 | 40 | 44 | 80 | 24 | 26 | 61 | 57 | 49 | 26 |
| 2006 | 43 | 33 | 19 | 30 | 22 | 58 | 18 | 38 | 18 | 46 | 51 | 38 |
| 2007 | 57 | 13 | 41 | 42 | 33 | 51 | 62 | 110 | 353 | 30 | 41 | 22 |
| 2008 | 64 | 12 | 63 | 41 | 46 | 69 | 28 | 37 | 19 | 44 | 55 | 16 |
| 2009 | 52 | 51 | 28 | 60 | 63 | 116 | 108 | 17 | 42 | 117 | 59 | 9 |
| 2010 | 174 | 17 | 115 | 89 | 164 | 4 | 168 | 99 | 116 | 145 | 87 | 164 |
| 2011 | 117 | 53 | 170 | 167 | 142 | 117 | 234 | 113 | 112 | 196 | 210 | 125 |
| 2012 | 259 | 73 | 153 | 108 | 111 | 150 | 130 | 148 | 45 | 83 | 129 | 106 |
| 2013 | 169 | 71 | 172 | 92 | 208 | 153 | 163 | 114 | 216 | 225 | 271 | 170 |
| 2014 | 85 | 155 | 198 | 133 | 140 | 189 | 241 | 208 | 358 | 89 | 174 | 153 |
| 2015 | 120 | 269 | 175 | 155 | 209 | 321 | 291 | 149 | 227 | 329 | 301 | 230 |
| 2016 | 415 | 208 | 195 | 269 | 385 | 262 | 210 | 309 | 178 | 272 | 313 | 224 |
| 2017 | 270 | 166 | 459 | 223 | 459 | 256 | 418 | 385 | 364 | 310 | 192 | 424 |
| 2018 | 323 | 372 | 194 | 431 | 330 | 525 | 485 | 481 | 431 | 522 | 391 | 381 |
| 2019 | 591 | 316 | 363 | 425 | 567 | 349 | 299 | 499 | 396 | 366 | 338 | 448 |
| 2020 | 334 | 422 | 446 | 228 | 431 | 270 | 183 | 363 | 534 | 510 | 293 | 295 |
| 2021 | 508 | 423 | 459 | 233 | 525 | 502 | 567 | 508 | 143 | 471 | 375 | 463 |
| 2022 | 246 | 230 | 682 | 405 | 595 | 245 | 563 | 185 | 79 | 425 | 303 | 77 |
| 2023 | 488 | 143 | 412 | 355 | 505 | 177 | 502 | 78 | 403 | 150 | 1,104 | 545 |
| 2024 | 276 | 146 | 343 | 416 | 224 | 593 | 332 | 257 | 483 | 155 | 231 | 294 |
| 2025 | 322 | 292 | 312 | 266 | ||||||||
| - = No Data Reported; -- = Not Applicable; NA = Not Available; W = Withheld to avoid disclosure of individual company data. |
| Release Date: 6/30/2025 |
| Next Release Date: 7/31/2025 |