|
Download Data (XLS File) |
|
||||||||
|
||||||||
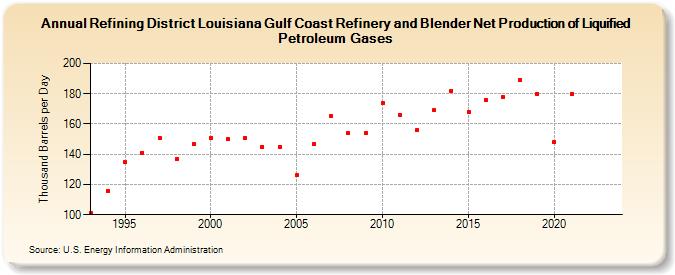
| Refining District Louisiana Gulf Coast Refinery and Blender Net Production of Liquified Petroleum Gases (Thousand Barrels per Day) | ||||||||
| Decade | Year-0 | Year-1 | Year-2 | Year-3 | Year-4 | Year-5 | Year-6 | Year-7 | Year-8 | Year-9 |
|---|---|---|---|---|---|---|---|---|---|---|
| 1990's | 101 | 116 | 135 | 141 | 151 | 137 | 147 | |||
| 2000's | 151 | 150 | 151 | 145 | 145 | 126 | 147 | 165 | 154 | 154 |
| 2010's | 174 | 166 | 156 | 169 | 182 | 168 | 176 | 178 | 189 | 180 |
| 2020's | 148 | 180 | -- | -- |
| - = No Data Reported; -- = Not Applicable; NA = Not Available; W = Withheld to avoid disclosure of individual company data. |
| Release Date: 3/29/2024 |
| Next Release Date: 8/30/2024 |