|
Download Data (XLS File) |
|
||||||||
|
||||||||
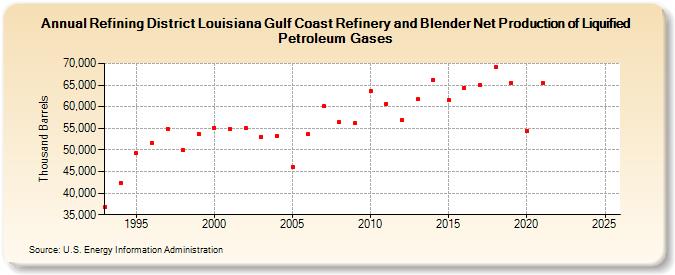
| Refining District Louisiana Gulf Coast Refinery and Blender Net Production of Liquified Petroleum Gases (Thousand Barrels) | ||||||||
| Decade | Year-0 | Year-1 | Year-2 | Year-3 | Year-4 | Year-5 | Year-6 | Year-7 | Year-8 | Year-9 |
|---|---|---|---|---|---|---|---|---|---|---|
| 1990's | 36,698 | 42,445 | 49,170 | 51,626 | 54,938 | 49,961 | 53,696 | |||
| 2000's | 55,175 | 54,884 | 54,991 | 53,033 | 53,238 | 46,065 | 53,582 | 60,056 | 56,393 | 56,253 |
| 2010's | 63,658 | 60,712 | 57,001 | 61,713 | 66,271 | 61,463 | 64,399 | 65,029 | 69,114 | 65,549 |
| 2020's | 54,337 | 65,536 | -- | -- |
| - = No Data Reported; -- = Not Applicable; NA = Not Available; W = Withheld to avoid disclosure of individual company data. |
| Release Date: 6/28/2024 |
| Next Release Date: 8/30/2024 |