|
Download Data (XLS File) |
|
||||||||
|
||||||||
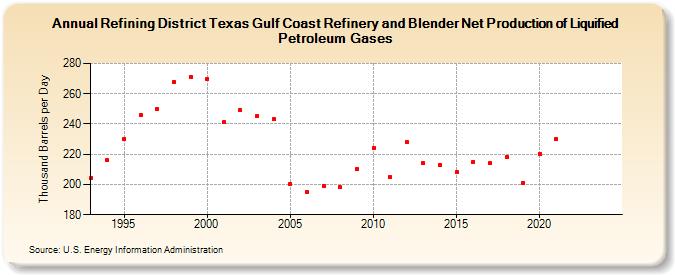
| Refining District Texas Gulf Coast Refinery and Blender Net Production of Liquified Petroleum Gases (Thousand Barrels per Day) | ||||||||
| Decade | Year-0 | Year-1 | Year-2 | Year-3 | Year-4 | Year-5 | Year-6 | Year-7 | Year-8 | Year-9 |
|---|---|---|---|---|---|---|---|---|---|---|
| 1990's | 204 | 216 | 230 | 246 | 250 | 268 | 271 | |||
| 2000's | 270 | 241 | 249 | 245 | 243 | 200 | 195 | 199 | 198 | 210 |
| 2010's | 224 | 205 | 228 | 214 | 213 | 208 | 215 | 214 | 218 | 201 |
| 2020's | 220 | 230 | -- | -- |
| - = No Data Reported; -- = Not Applicable; NA = Not Available; W = Withheld to avoid disclosure of individual company data. |
| Release Date: 3/29/2024 |
| Next Release Date: 8/30/2024 |